SUI’s Rounding Bottom Signals Potential Breakout: Is a Rally Looming?

The Sui (SUI) cryptocurrency has been in an uptrend, capturing the attention of investors and traders alike. Despite stiff resistance at the $1.50 mark, the digital asset exhibits bullish, solid momentum, hinting at potential future gains. In the last 24 hours, however, the SUI has experienced a slight price correction, causing some uncertainty among investors.
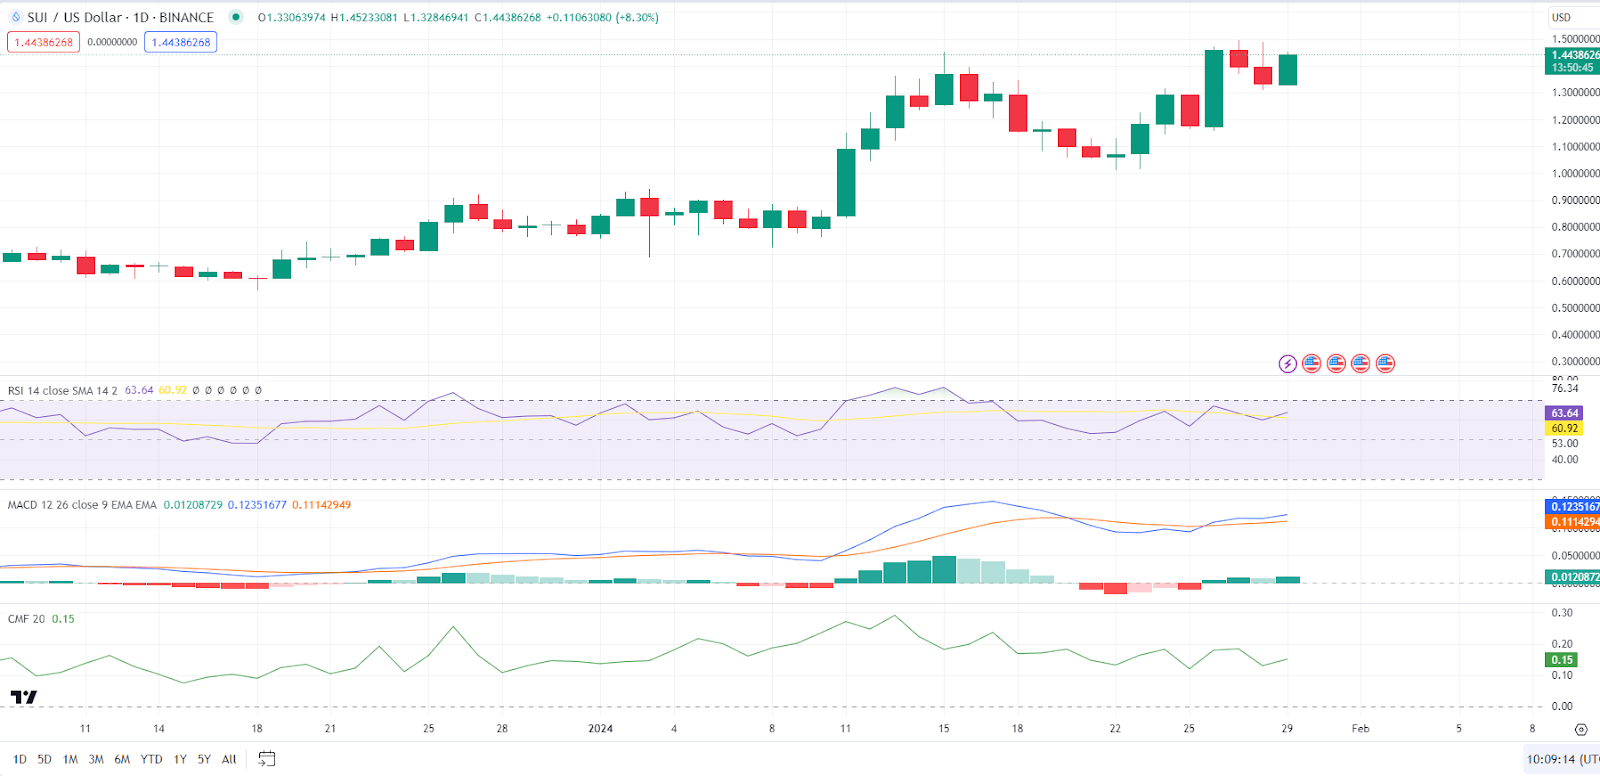
During the correction, the SUI price dipped to an intra-day low of $1.31, where support was found, leading to a bounce back toward the $1.40 level. This price action suggests that there is still strong buying interest in SUI, and investors may see this correction as a buying opportunity to enter or add to their positions. At press time, SUI was trading at $1.43, a 3.19% surge from the intra-day low.
SUI/USD 24-hour price chart (source: CoinStats)
However, market analysis reveals that the SUI/USD trading pair has been forming a rounding bottom pattern, a bullish indicator. This pattern, characterized by a gradual decline followed by a steady rise, suggests that Sui could be on the brink of a significant breakout. A successful breach and closure above the $1.50 threshold could propel the cryptocurrency towards the $2.00 mark, with the ultimate pattern target set at $2.50.
SUI/USD Technical Analysis
The Relative Strength Index (RSI) rating of 63.79 on the SUI price chart indicates that bull momentum is now strong. This tendency shows that the price will likely continue to rise soon. However, if the RSI rating increases above 70, the price may be overbought and due for a drop.
Furthermore, the Moving Average Convergence Divergence (MACD) shift above its signal line with a rating of 0.123341 indicates that bullish momentum is increasing. This MACD shift signals that purchasing pressure is building and may push the price higher soon. However, if the MACD shift reverses and moves below its signal line, it may indicate a loss of bullish momentum and a potential trend reversal.

CMF/USD 24-hour price chart (source: TradingView)
The Chaikin Money Flow (CMF) motion in the positive region, with a reading of 0.15, reinforces the bullish momentum and suggests intense purchasing pressure in the market. This CMF reading indicates a solid flow of money entering the market, strengthening the case for a bull rally.
Disclaimer: The information presented in this article is for informational and educational purposes only. The article does not constitute financial advice or advice of any kind. Coin Edition is not responsible for any losses incurred as a result of the utilization of content, products, or services mentioned. Readers are advised to exercise caution before taking any action related to the company.


 Bitcoin
  Ethereum
  Tether
  USDC
USDC  Dogecoin
  TRON
TRON  Cardano
  Bitcoin Cash
  Chainlink
  LEO Token
  Litecoin
  Dai
Dai  Monero
  Stellar
  Ethereum Classic
  Stacks
  OKB
OKB  Cronos
  Hedera
  Cosmos Hub
  KuCoin
  Gate
Gate  Theta Network
  Maker
Maker  Algorand
  Polygon
  Tether Gold
  NEO
NEO  EOS
EOS  Tezos
Tezos  Zcash
Zcash  TrueUSD
  Synthetix Network
  Bitcoin Gold
  IOTA
IOTA  Holo
Holo  Dash
Dash  Zilliqa
  Siacoin
  0x Protocol
  Ravencoin
  Basic Attention
  Enjin Coin
  Qtum
Qtum  Decred
  Ontology
  NEM
NEM  Lisk
Lisk  Pax Dollar
  Nano
Nano  Numeraire
  Waves
Waves  Status
  DigiByte
  Huobi
Huobi  Hive
Hive  Steem
Steem  BUSD
BUSD  Ren
Ren  OMG Network
  Bitcoin Diamond
  Bytom
Bytom  Kyber Network Crystal Legacy
  HUSD
HUSD