Peter Brandt Goes Long on Ethereum, Predicts Breakout to $4,032

Legendary trader Peter Brandt opens a long position in Ethereum with a target of $4,032, leveraging a descending wedge pattern to predict a bullish breakout from $2,741.
Peter Brandt, a seasoned trader and classical chartist, recently shared his current trades on social media, highlighting a notable bullish signal for Ethereum.
Brandt, known for his adherence to classical charting techniques from Schabacker’s 1934 methods, focuses on swing trading by identifying and trading breakout patterns. According to an X post, his trading approach has a 55% hit rate, implying his method’s reliability.
As a trader I’m a classical chartist (Schabacker, 1934)
I’m a swing trader who draws lines on charts & buys/sells pattern breakouts
Hit rate = 55%
Here are 4 trades I’m in now with entry/targets noted
Long $ETH spot
Long Meal futures $ZMN24
Long $GLD
Long Silver futures $SIU24 pic.twitter.com/pc1V8WJxhO— Peter Brandt (@PeterLBrandt) May 26, 2024
Brandt Targets $4,032 in Ethereum
Peter Brandt’s chart analysis indicates a classic descending wedge pattern for Ethereum, a bullish signal that typically suggests an upward breakout. According to the chart, the breakout has already been confirmed by a sharp increase in price past the upper trendline of the wedge.
Moreover, Brandt shows that his entry point for Ethereum was at $2,741, anticipating the upward momentum. He further anticipates a target of $4,032, suggesting significant profit potential and reflecting confidence in Ethereum’s continued rise.
In addition to his Ethereum trade, Peter Brandt has revealed three other strategic positions, further diversifying his portfolio. He has gone long on Soybean Meal futures (ZMN24), SPDR Gold Trust (GLD), and Silver futures (SIU24). Each of these trades is based on his classical charting techniques, aiming to profit from anticipated breakout movements.
Brandt’s Ethereum Criticisms
In contrast to his current bullish stance, Brandt predicted in December of last year that Ethereum could experience a severe downturn, potentially dropping below $700. At that time, Brandt noted that classical chart patterns in price charts are not infallible and often fail to perform as expected.
Had ETH fallen to $650 from its value of $2,156 at the time, it would have marked a near 70% decline for the leading smart contract platform. Moreover, last Friday, he warned of potential risks in the crypto staking sector following the U.S. SEC’s approval of spot Ethereum ETFs.
Brandt cautioned that the complexities of staking could lead to substantial financial pitfalls for uninformed investors.
Staking
=
Owning/borrowing/leveraging an asset (ETH/SOL/name it)
Lending it out for revenue (i.e.: interest)
=
Eventual involvement by CBs/govt treasuries
=
Regulatory authority over staking
=
End to staking https://t.co/hv835g3pfK— Peter Brandt (@PeterLBrandt) May 24, 2024
ETH Price Action
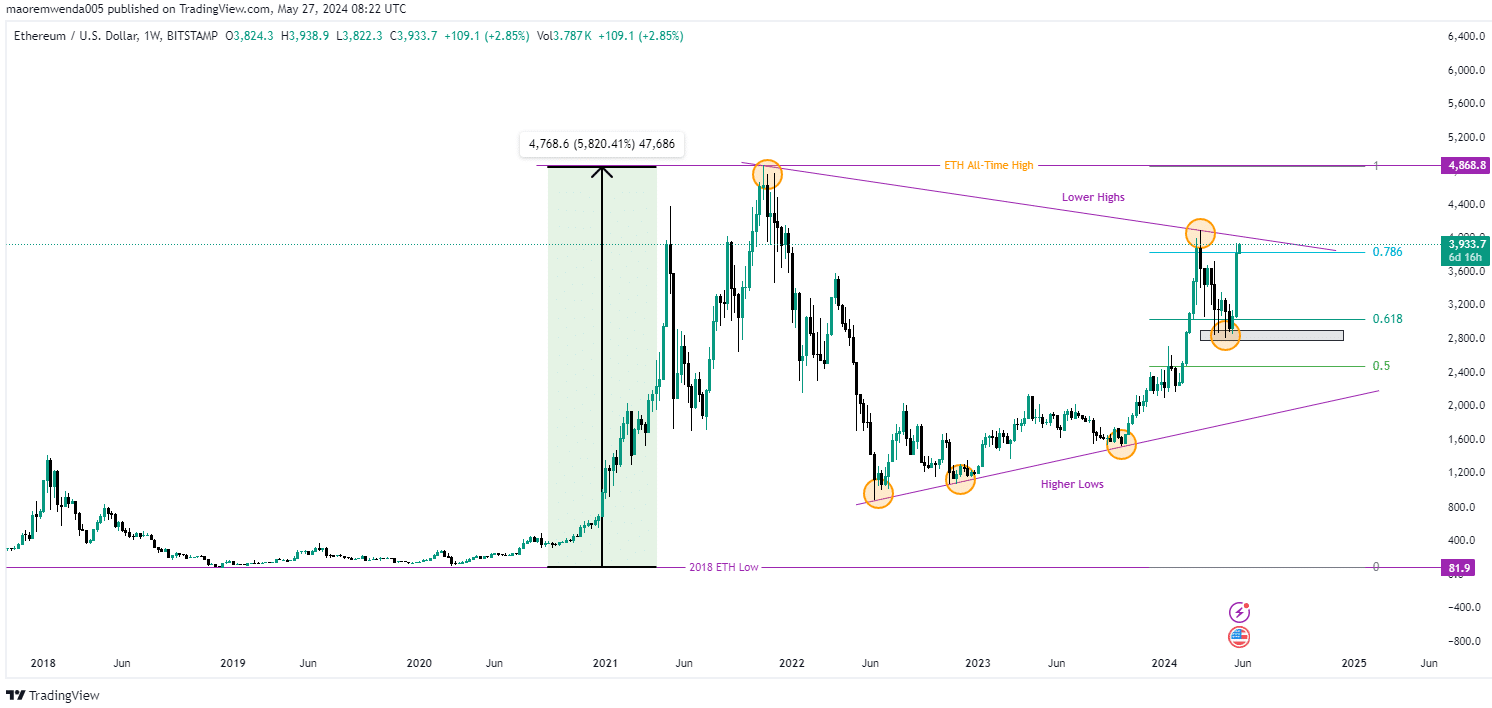
Meanwhile, on the weekly chart, ETH presently exhibits a symmetrical triangle pattern characterized by lower highs and higher lows. The descending resistance line, drawn from the all-time high of $4,868.8, forms the upper boundary of this long-term descending triangle pattern.
Complementing this, the ascending support line, extending from the 2018 low, delineates the lower boundary, creating a significant structural formation on the price chart.

<i style=color 222222 font size 15px>ETHUSD 1 Week Chart Source <i><a style=font size 15px href=httpswwwtradingviewcomxc3BhOHVf target= blank rel=nofollow noopener><i>Tradingview<i><a><i style=color 222222 font size 15px><i>
According to the chart, Ethereum marked a low of around $81.9 in 2018, signaling the beginning of a substantial upward trend. This momentum eventually propelled ETH to its ATH of $4,868.
More recently, the token has rebounded from the 0.618 Fibonacci retracement level near $3,000, underscoring strong support at this price point.
In a bullish scenario, a successful break above the descending resistance line and the 0.786 Fibonacci level around $3,900 could pave the way towards the ATH near $4,868.8. A confirmed breakout beyond this level would be a robust bullish indicator, possibly leading to new record highs.
Conversely, a bearish scenario would unfold if Ethereum fails to overcome the resistance and drops below the 0.618 level. This could lead to a retest of lower support levels, including the crucial ascending support line.


 Bitcoin
  Ethereum
  Tether
  Dogecoin
  USDC
USDC  Cardano
  TRON
TRON  Chainlink
  Hedera
  Stellar
  Bitcoin Cash
  LEO Token
  Litecoin
  Cronos
  Ethereum Classic
  Monero
  Dai
Dai  Algorand
  OKB
OKB  Cosmos Hub
  Stacks
  Theta Network
  Gate
Gate  Maker
Maker  Tezos
Tezos  KuCoin
  IOTA
IOTA  Zcash
Zcash  NEO
NEO  Polygon
  Synthetix Network
  Tether Gold
  Dash
Dash  TrueUSD
  Holo
Holo  0x Protocol
  Zilliqa
  Enjin Coin
  Basic Attention
  Qtum
Qtum  Siacoin
  Ravencoin
  Decred
  NEM
NEM  DigiByte
  Bitcoin Gold
  Ontology
  Nano
Nano  Status
  Lisk
Lisk  Huobi
Huobi  Waves
Waves  Hive
Hive  Numeraire
  Steem
Steem  Pax Dollar
  BUSD
BUSD  OMG Network
  Ren
Ren  Bitcoin Diamond