Ethereum’s supply rises by over 210,000 ETH amid Vitalik Buterin’s charity donation

- Ethereum ETFs post $10.8 million in net inflows.
- Ethereum’s annual inflation rate rose to 0.58% after its total supply increased by over 210,000 ETH in the past four months.
- Vitalik Buterin confirms 200 ETH sale was for a charity donation.
- Ethereum could rally toward its yearly high of $4,093 if it breaks above the ascending triangle’s resistance.
Ethereum (ETH) is down 0.7% on Thursday following three consecutive days of net inflows across ETH ETFs. Meanwhile, ETH’s annual inflation rate has continued trending upward amid signs of a potential bullish reversal.
Daily digest market movers: ETH ETF inflows, inflation rate, Vitalik Buterin’s donation
Ethereum ETFs recorded net inflows of $10.8 million on Wednesday, stretching their inflow streak to three days. BlackRock’s ETHA and Fidelity’s FETH saw inflows of $16.1 million and $6.6 million, respectively, while Grayscale’s ETHE posted outflows of $16.9 million.
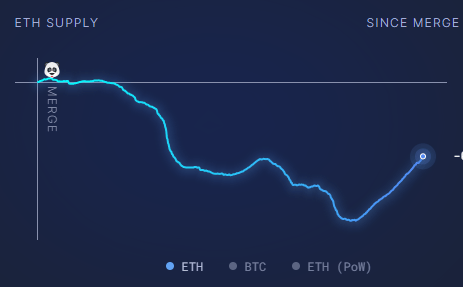
Ethereum’s annual inflation rate has increased to 0.58% after its net supply grew to 120.27 million ETH in the past 30 days, according to data from Ultrasound.money.
Since the Dencun upgrade in March, Ethereum’s supply has been in an uptrend, considering fewer transactions on the Main chain reduced ETH’s burn rate, which was meant to offset new issuance. This is evidenced in ETH’s supply change in the past 30 days. The network recorded 77,100 ETH issued against 19,300 ETH burned, increasing Ethereum’s total supply by 57,700 ETH.

ETH supply growth
Between April and August 2024, Ethereum’s total supply has grown by more than 210,000 ETH. A sustained uptrend in supply growth could negatively impact ETH’s price if demand declines or stays constant.
Ethereum co-founder Vitalik Buterin transferred 200 ETH worth about $532,000 to the Kraken exchange in the past 24 hours. While many earlier interpreted the transfer as profit-taking, Buterin later clarified that the 200 ETH was a donation to charity. Buterin received the funds from the sale of animal-themed meme coins he received in the past year.
Charity donation done, covering all animal coins from the past year or so!
That said, I appreciate it if coin holdings just get allocated to the charities directly
It’s 2024, we can start doing more sophisticated public goods fun-ding, eg. see https://t.co/8ZVhwkVwLy pic.twitter.com/RQ1ThdLCYL
— vitalik.eth (@VitalikButerin) August 15, 2024
ETH technical analysis: Ethereum could rally if ascending triangle continues
Ethereum is trading around $2,650 on Thursday, down 0.7% on the day. In the past 24 hours, ETH has seen over $32 million in liquidations, with long and short liquidations accounting for $24.51 million and $7.55 million, respectively.
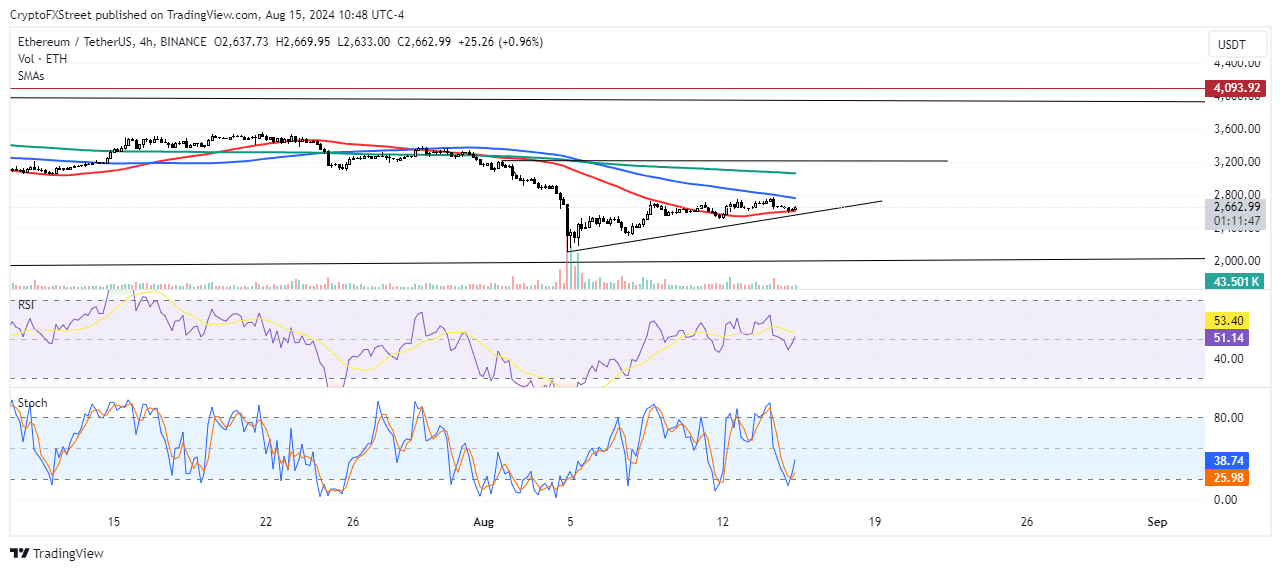
On the 4-hour chart, ETH appears to be following an ascending triangle since the market dip on August 5. This signals a potential reversal on the horizon.

ETH/USDT 4-hour chart
The 200-day Simple Moving Average (SMA) has served as a resistance since July 28, when the 50-day SMA moved below it in a Death Cross pattern.
If ETH continues posting higher lows and breaks above the upper resistance line around the psychological level of $3,200, it could rally toward its yearly resistance of $4,093.
This move is supported by the Relative Strength Index (RSI), which is attempting to move above its moving average. If the RSI successfully crosses above the moving average, ETH could see a brief rise in the coming days.
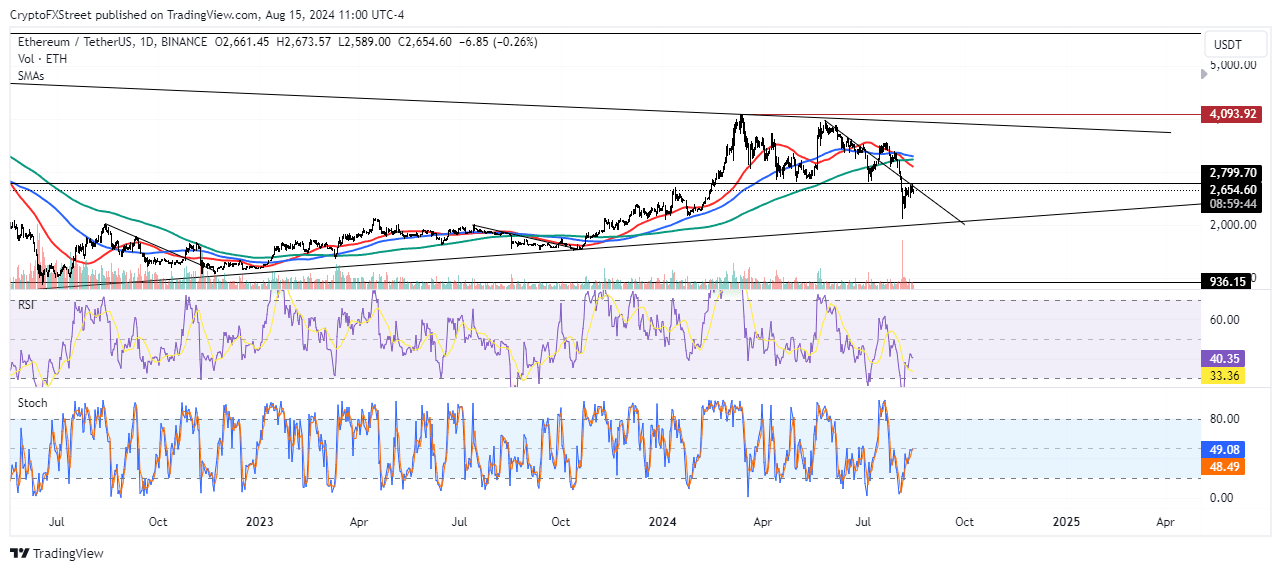
Meanwhile, on the daily chart, ETH faces a key trendline resistance that suggests its price could decline to the $2,000 to $2,200 range in the coming weeks. ETH has previously posted similar moves from August 2022 to November 2022 and July 2023 to August 2023.

ETH/USDT Daily chart
A daily candlestick close below the lower rising trendline could trigger a heavy correction for ETH.
Share: Cryptos feed


 Bitcoin
  Ethereum
  Tether
  USDC
USDC  Dogecoin
  Cardano
  TRON
TRON  Chainlink
  Bitcoin Cash
  LEO Token
  Litecoin
  Dai
Dai  Ethereum Classic
  Monero
  Stellar
  Cronos
  Stacks
  OKB
OKB  Hedera
  Cosmos Hub
  Maker
Maker  KuCoin
  Theta Network
  Gate
Gate  Algorand
  Polygon
  NEO
NEO  EOS
EOS  Tezos
Tezos  Tether Gold
  Zcash
Zcash  Synthetix Network
  TrueUSD
  IOTA
IOTA  Bitcoin Gold
  Holo
Holo  Dash
Dash  0x Protocol
  Zilliqa
  Siacoin
  Enjin Coin
  Ravencoin
  Qtum
Qtum  Basic Attention
  Decred
  Ontology
  NEM
NEM  Lisk
Lisk  Nano
Nano  Numeraire
  Waves
Waves  Pax Dollar
  DigiByte
  Status
  Hive
Hive  Huobi
Huobi  Steem
Steem  BUSD
BUSD  Ren
Ren  OMG Network
  Bitcoin Diamond
  Bytom
Bytom  Kyber Network Crystal Legacy
  HUSD
HUSD