Solana could rally as Breakpoint conference approaches

- Solana witnessed the highest single-day daily active address growth on its network.
- SOL has historically rallied prior to the Solana Breakpoint conference.
- SOL could rally toward $163 if it sustains an extended move above the $136 key resistance.
Solana (SOL) is up 0.5% on Tuesday, following significant growth in its network daily active addresses. Investors anticipate a potential rally as the Solana Breakpoint conference approaches.
SOL needs other key metrics to catch up to fuel pre-Breakpoint rise
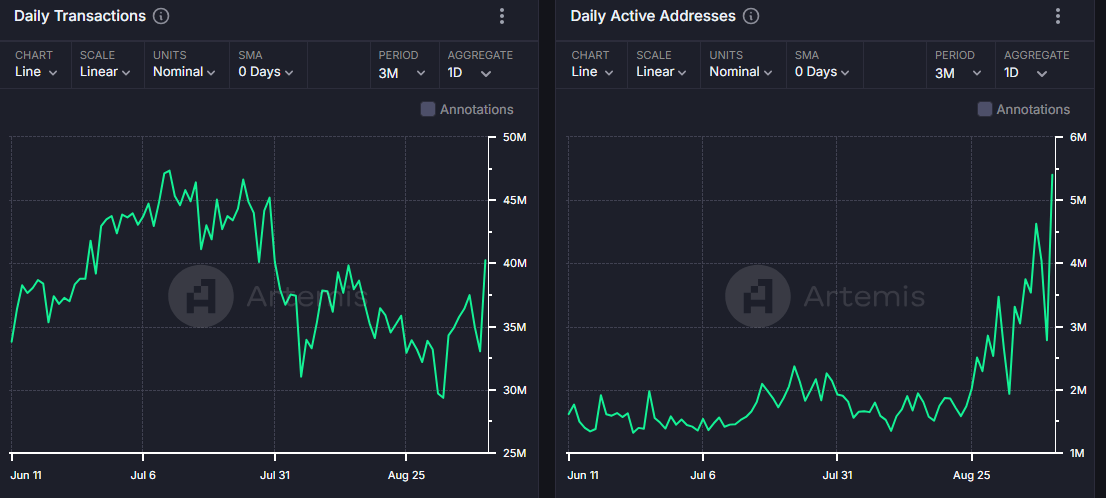
With ten days to the Solana Breakpoint annual conference, the Solana network is experiencing heightened network activity. According to data from Artemis, Solana witnessed its highest single-day daily active address (DAA) growth on Tuesday after adding over 5.4 million new addresses.

SOL Daily Active Addresses & Daily Transactions
Solana’s daily transactions are also rising, growing by 22% to 40.3 million between September 8 and 9. This steady growth could help Solana’s network fees recover from the downward trend it has been on since August.
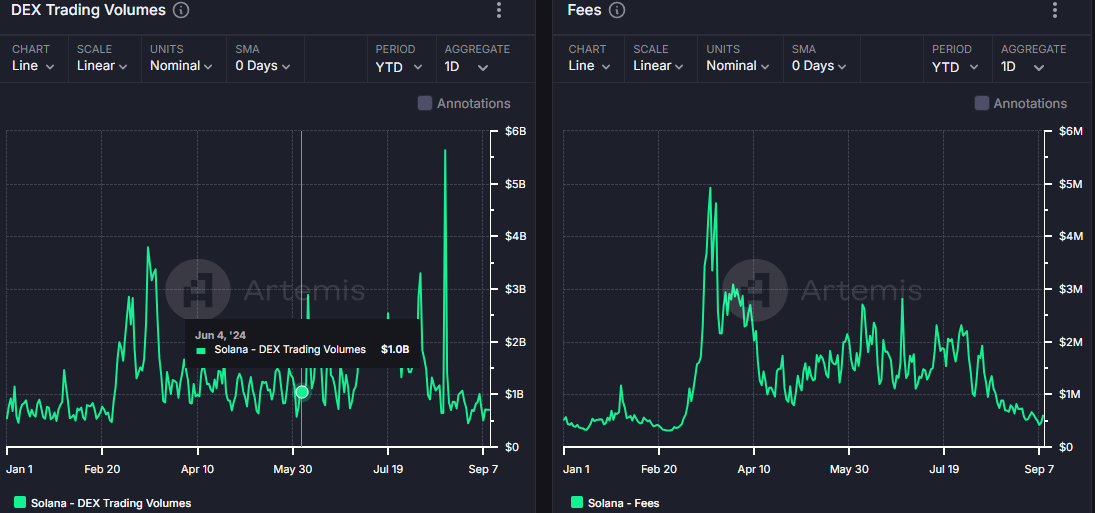
Network fees are currently at around $595K, levels last seen before the meme coin frenzy in March. A similar trend is visible in Solana’s decentralized exchange (DEX) trading volume, which declined by over 27% in August.
If Solana network fees and DEX trading volume increase as the Breakpoint conference approaches, it could fuel a SOL rise in the coming weeks. The Solana Breakpoint conference will run from September 20 – 21, 2024.

SOL DEX Trading Volume & Network Fees
According to analyst @ali_charts, SOL has historically seen a price rise two weeks before the Solana Breakpoint conference. He noted that SOL surged by 35% in 2021 and 2022 and by 60% in 2023 prior to the conference. As a result, it’s crucial for investors to watch out for a potential price rise in the coming days.
During such conferences, projects tend to do product reveals, which may lead to a bullish spark. Hence, it may also prove beneficial to pay close attention to tokens within the Solana ecosystem.
On the flip side, industry events are also often treated as sell-the-news events, leading to a potential price decline within key projects.
SOL could rally further above key resistance
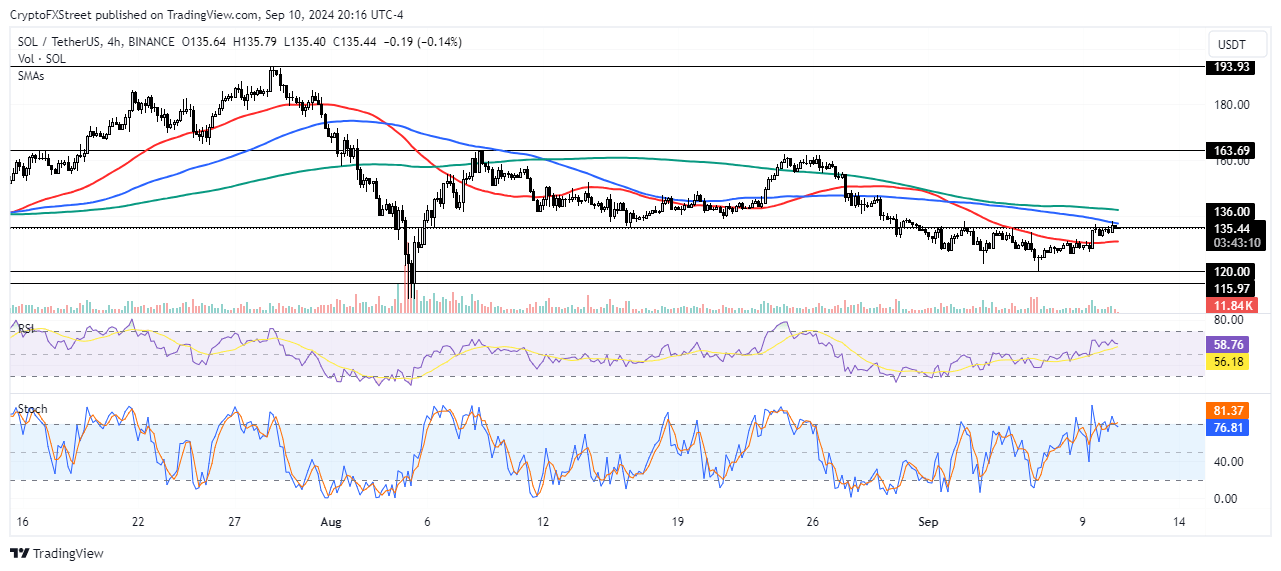
On the 4-hour chart, SOL is attempting to sustain a move above a key rectangle’s resistance around $136. A sustained move above this level could see SOL rally toward $163. However, failure to trade extensively above $136 could see SOL decline toward the $120 support level.

SOL/USDT 4-hour chart
The 200-day Simple Moving Average (SMA) stands as resistance on the way up and could prevent a further rise in SOL. The Relative Strength Index (RSI) is above the midline at 60, indicating rising bullish momentum. The %K and %D lines of the Stochastic Oscillator (Stoch) have crossed into the oversold region, meaning a short-term correction may be imminent.
In the short term, SOL could fall to $132 to liquidate positions worth $16.02 million.
Share: Cryptos feed


 Bitcoin
  Ethereum
  Tether
  Dogecoin
  USDC
USDC  Cardano
  TRON
TRON  Chainlink
  Stellar
  Hedera
  Bitcoin Cash
  LEO Token
  Litecoin
  Cronos
  Ethereum Classic
  Monero
  Dai
Dai  Algorand
  OKB
OKB  Cosmos Hub
  Stacks
  Theta Network
  Gate
Gate  Maker
Maker  KuCoin
  Tezos
Tezos  IOTA
IOTA  Zcash
Zcash  NEO
NEO  Polygon
  Synthetix Network
  Tether Gold
  TrueUSD
  Dash
Dash  Holo
Holo  Zilliqa
  Enjin Coin
  0x Protocol
  Basic Attention
  Qtum
Qtum  Siacoin
  Ravencoin
  Bitcoin Gold
  Decred
  NEM
NEM  Ontology
  DigiByte
  Nano
Nano  Status
  Hive
Hive  Huobi
Huobi  Waves
Waves  Lisk
Lisk  Numeraire
  Steem
Steem  Pax Dollar
  BUSD
BUSD  OMG Network
  Ren
Ren  Bitcoin Diamond
  Bytom
Bytom