XRP to $4.20? XRP Sees Tightest Bollinger Bands Since 2016

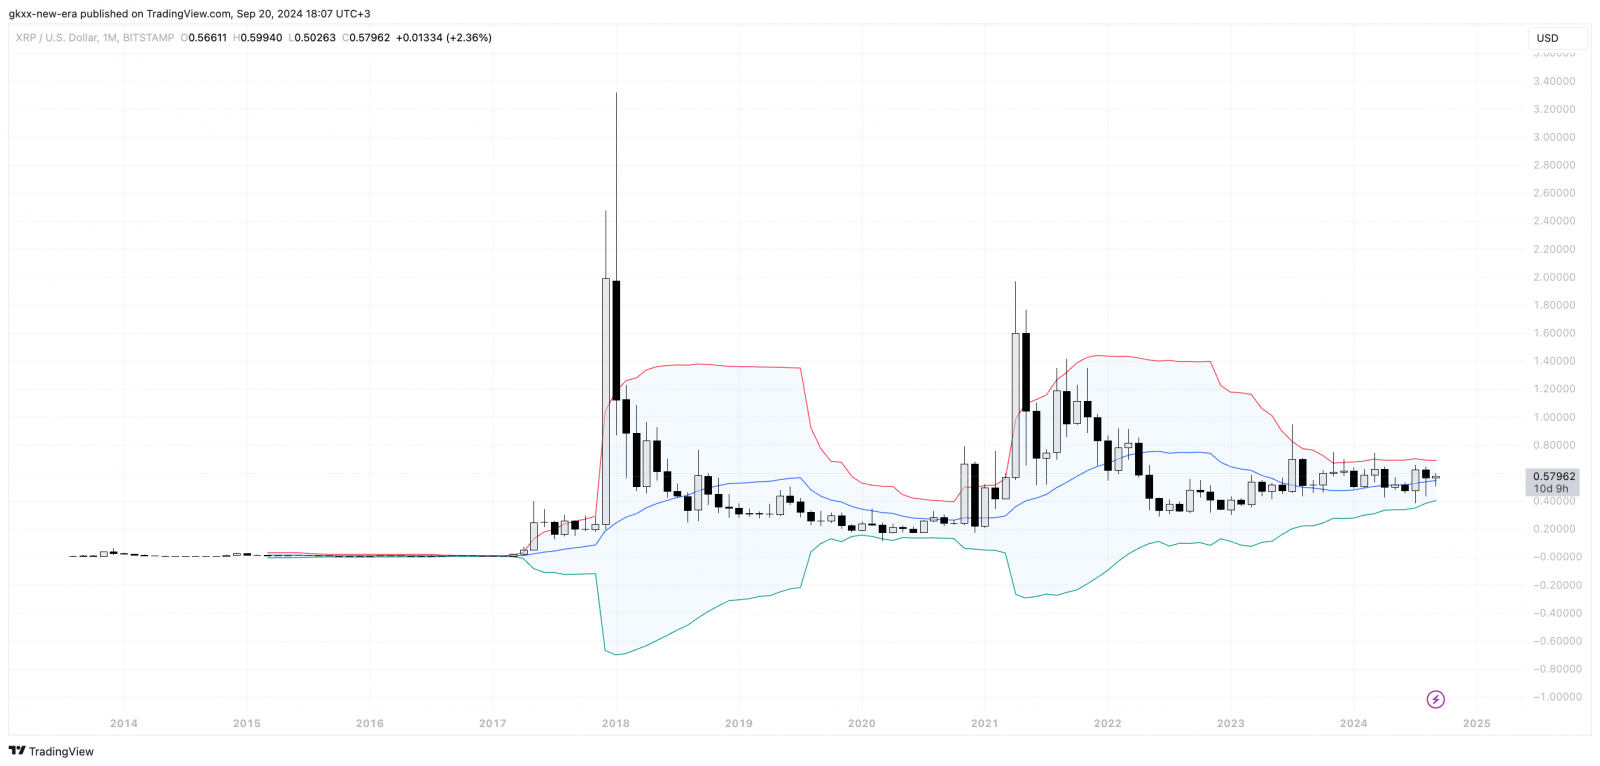
It looks like the popular cryptocurrency XRP might be on the verge of some big changes in its space, according to the Bollinger Bands indicator. Right now, XRP is trading at $0.5825, but what is more important is that the Bollinger Bands are tighter than they hae been since 2016. This could mean a big price shift, which traders are keeping an eye on.
The Bollinger Bands are a tool used to measure market volatility. When the bands contract, it suggests that the market is becoming less unpredictable, which could signal a potential turning point.
The last time XRP’s Bollinger Bands were this narrow was before the impressive 60,000% rally that happened in 2017. During that period, XRP’s price shot up from $0.006 to $3.84, which was one of the most notable price surges in the history of the seventh largest cryptocurrency.

If we look back at the XRP price chart from 2017, we can say that the Bollinger Bands tightened by about 115% between the lower and upper bands. Then, in 2020, there was another tightening, worth a bit more than 200%, after which the price of XRP skyrocketed by 716.46%.
Now the Bollinger Bands are tightening at 71.47%, and some analysts and enthusiasts are even saying that $4.2 per XRP is a potential new all-time high for the popular cryptocurrency.
Many are saying that a similar breakout could be on the way, even though it is hard to know for sure what will happen on the market.
There is no guarantee that history will repeat itself, but there are signs that there could be a big price move, which could have a major impact on XRP’s position on the market going forward.


 Bitcoin
  Ethereum
  Tether
  USDC
USDC  Dogecoin
  TRON
TRON  Cardano
  Chainlink
  Bitcoin Cash
  LEO Token
  Litecoin
  Dai
Dai  Monero
  Ethereum Classic
  Stellar
  Stacks
  OKB
OKB  Cronos
  Hedera
  Cosmos Hub
  Maker
Maker  Theta Network
  KuCoin
  Gate
Gate  Algorand
  Polygon
  NEO
NEO  EOS
EOS  Zcash
Zcash  Tether Gold
  Tezos
Tezos  TrueUSD
  Synthetix Network
  IOTA
IOTA  Bitcoin Gold
  Holo
Holo  Dash
Dash  Zilliqa
  0x Protocol
  Siacoin
  Enjin Coin
  Ravencoin
  Basic Attention
  Qtum
Qtum  Decred
  Ontology
  NEM
NEM  Lisk
Lisk  Nano
Nano  Numeraire
  Pax Dollar
  DigiByte
  Waves
Waves  Status
  Huobi
Huobi  Hive
Hive  Steem
Steem  BUSD
BUSD  Ren
Ren  OMG Network
  Bitcoin Diamond
  Bytom
Bytom  Kyber Network Crystal Legacy
  HUSD
HUSD