Expert Says XRP to Rip Higher as It Attempts Bullish Breakout 6 Times in 2 Months

XRP has stood out during the current market cycle with expert analysts like Javon Marks signaling a significant bullish trend on the horizon.
Over the last two months, XRP has demonstrated remarkable resilience, attempting a bullish breakout more than six times since late July 2024. This pattern hints at an imminent surge that could see its value skyrocket to the $2-3 range soon.
Initial Analysis
In his initial analysis shared on Sept. 11, Marks highlighted the presence of multiple Hidden Bull Divergences in XRP’s price movements. Notably, despite XRP’s upward push over the past few months, the momentum indicators have not picked up.
For the uninitiated, a hidden bullish divergence occurs when the price of an asset makes higher lows, indicating an ongoing uptrend, while the oscillator (like RSI, MACD) makes lower lows, suggesting bearish momentum.
These typically suggest a strong upward potential, capable of propelling XRP up by nearly 500% to around $3.31. This potential upsurge goes beyond XRP just reclaiming the $3.3 ATH. Notably, this also points to a breakthrough of a nearly 7-year resistance trend, setting a bullish precedent.
Updated XRP Analysis
In his most recent analysis, Marks confirmed that XRP’s outlook is now more bullish. According to Marks, the repeated efforts at a bullish breakout, coupled with favorable market signals, suggest that a major leap in price might be closer than many anticipate.
$XRP has attempted a bullish breakout about 6 times or more since late July 2024 and with signals pointing towards a return back above $2-3, a holding and sustained breakout may be a matter of time and closer than many think!
In any moment, we can see XRP completely ‘rip’… https://t.co/4XS2uQuRtL
— JAVON⚡️MARKS (@JavonTM1) September 25, 2024
The anticipation builds around XRP’s potential to “rip” higher, sparking a growth trend that multiple investors and traders are currently awaiting.
XRP Symmetrical Triangle
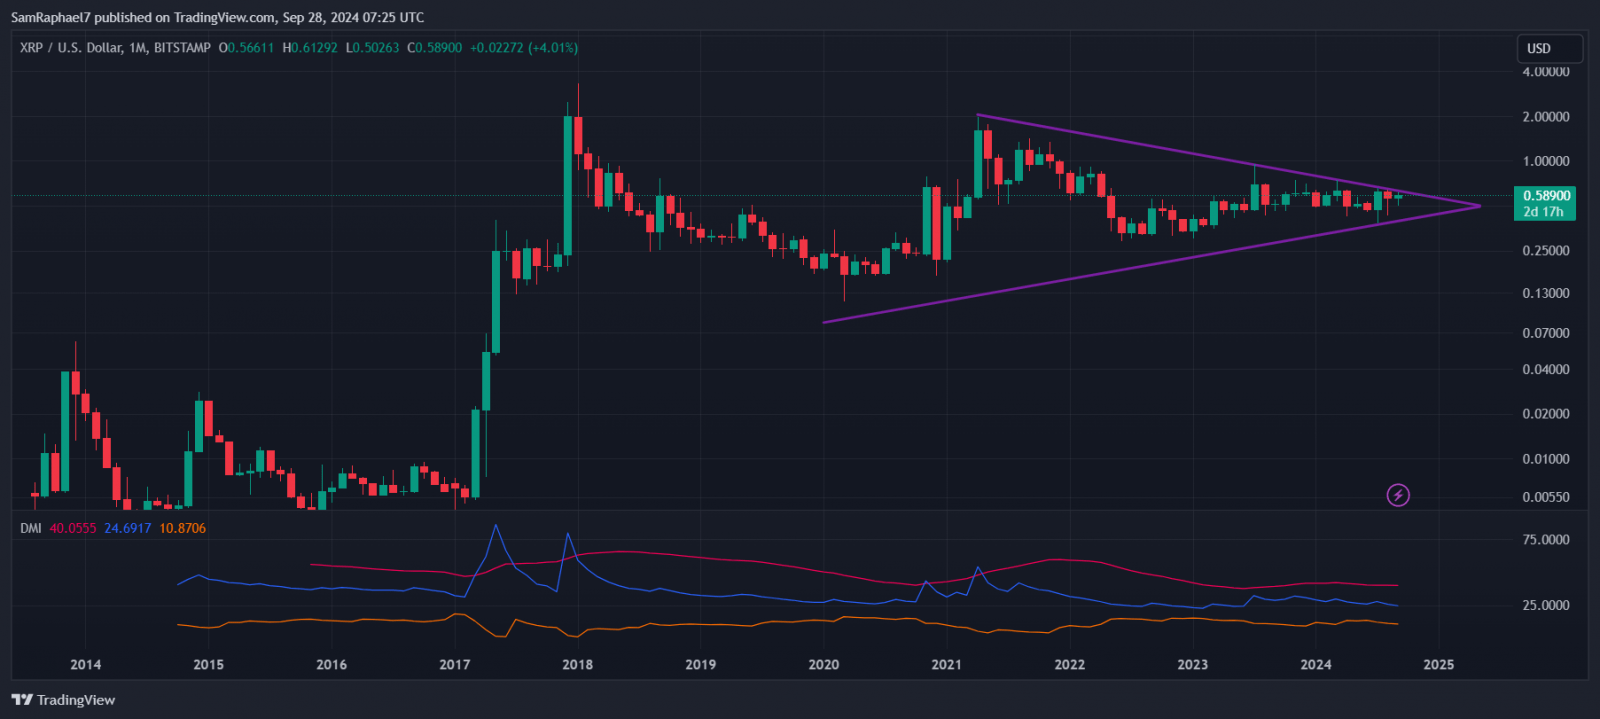
Meanwhile, a look the monthly chart shows XRP trading within a symmetrical triangle. This pattern began forming back in April 2021 after a drop from a high of $1.96. Over the past three years, XRP has navigated this triangle, now nearing its apex—a critical point that could indeed trigger the upsurge.

XRP Monthly Chart
In addition, multiple indicators further points to an imminent uptick. The monthly Directional Movement Index (DMI) reveals the +DI (Positive Directional Indicator) at 24.69. This confirms the predominant buying pressure, although the +DI has seen a slight decline in the past two months.
However, the -DI (Negative Directional Indicator) stands at 10.87, indicating reduced selling pressure, while the ADX (Average Directional Movement Index) at 40 suggests a strong trend. These figures, moving sideways recently, still support a potential breakout due to the accumulated pressure within the triangle.


 Bitcoin
  Ethereum
  Tether
  Dogecoin
  USDC
USDC  Cardano
  TRON
TRON  Chainlink
  Stellar
  Hedera
  Bitcoin Cash
  LEO Token
  Litecoin
  Cronos
  Ethereum Classic
  Monero
  Dai
Dai  Algorand
  OKB
OKB  Cosmos Hub
  Stacks
  Theta Network
  Gate
Gate  Maker
Maker  Tezos
Tezos  KuCoin
  IOTA
IOTA  NEO
NEO  Zcash
Zcash  Polygon
  Synthetix Network
  Tether Gold
  TrueUSD
  Dash
Dash  Holo
Holo  Zilliqa
  Enjin Coin
  0x Protocol
  Basic Attention
  Qtum
Qtum  Siacoin
  Ravencoin
  Bitcoin Gold
  Decred
  NEM
NEM  DigiByte
  Ontology
  Nano
Nano  Status
  Hive
Hive  Huobi
Huobi  Waves
Waves  Lisk
Lisk  Steem
Steem  Numeraire
  Pax Dollar
  BUSD
BUSD  OMG Network
  Ren
Ren  Bitcoin Diamond
  Bytom
Bytom