Top 3 Price Prediction Bitcoin, Ethereum, Ripple: BTC, ETH and XRP hints for a pullback ahead

- Bitcoin price action shows a bearish momentum on the RSI indicator, suggesting a decline ahead.
- Ethereum price faces resistance around the $4,000 level, indicating a pullback ahead.
- Ripple price rejects the $2.66 resistance level, suggesting a downturn on the horizon.
Bitcoin (BTC), Ethereum (ETH) and Ripple (XRP) all face resistance at their crucial level, indicating a pullback in the upcoming days.
Bitcoin bulls show signs of exhaustion
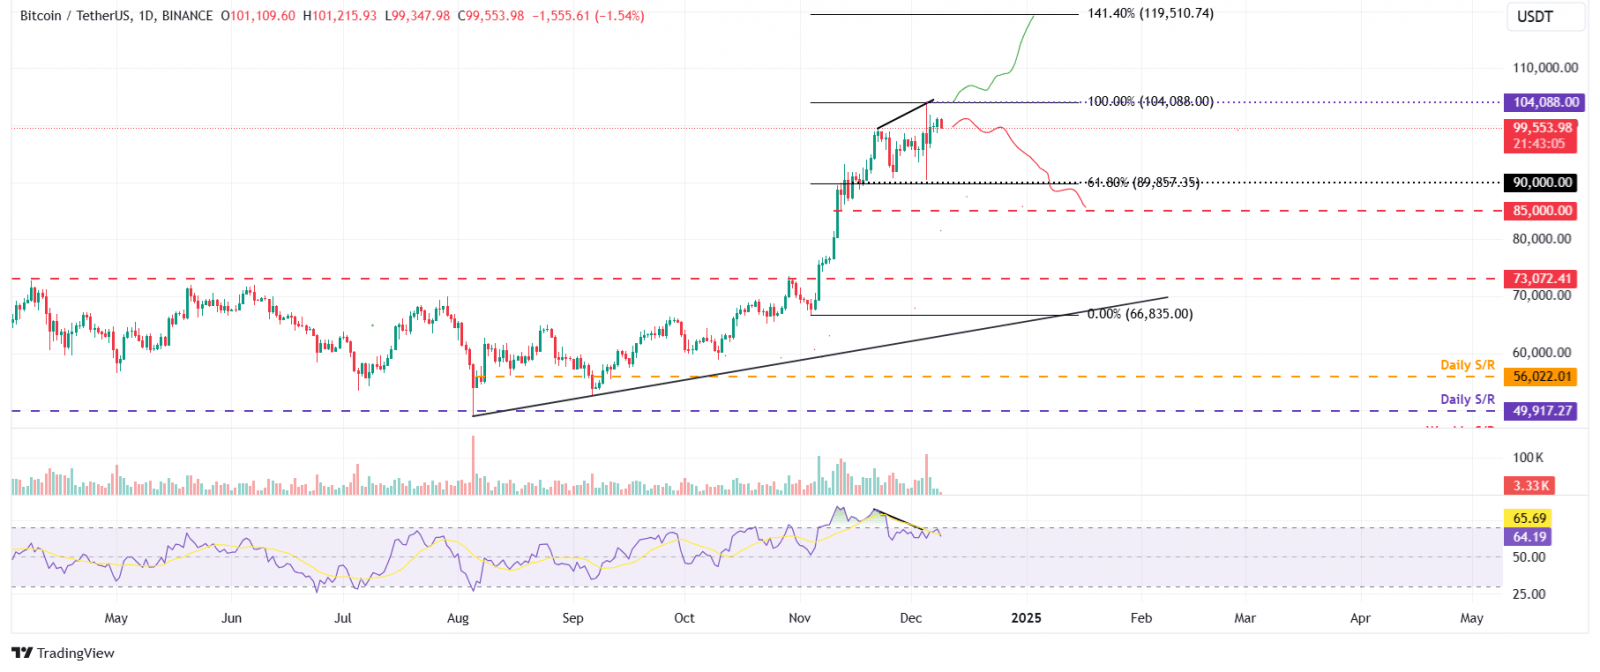
Bitcoin price reached a new all-time high (ATH) of $104,088 on Thursday. It then fell sharply to a daily low of $90,500 but recovered and closed above $96,900 on the same day. BTC rose 4.3% in the next three days until Sunday. At the time of writing on Monday, it trades slightly down around $99,500.
Despite the recovery from Thursday’s fall and rising until Sunday, Bitcoin’s Relative Strength Index (RSI) flashes warning signs. The higher high formed on Thursday does not reflect the RSI chart for the same period, indicating a formation of a bearish divergence, which often leads to a short-term correction.
If this bearish divergence plays out, traders could expect a small rise towards the recent high of $104,088 (grabbing liquidity or trapping longs), to then fall sharply towards the $90,000 support level. A successful close below this level could extend an additional decline towards the next support level of $85,000.

BTC/USDT daily chart
However, if BTC continues its uptrend and closes above $104,088, it could extend the rally toward the new all-time high of $119,510. This level aligns with the 141.4% Fibonacci extension line drawn from the November 4 low of $66,835 to Thursday’s all-time high of $104,088.
Ethereum price is set for a pullback as it faces resistance at $4,000
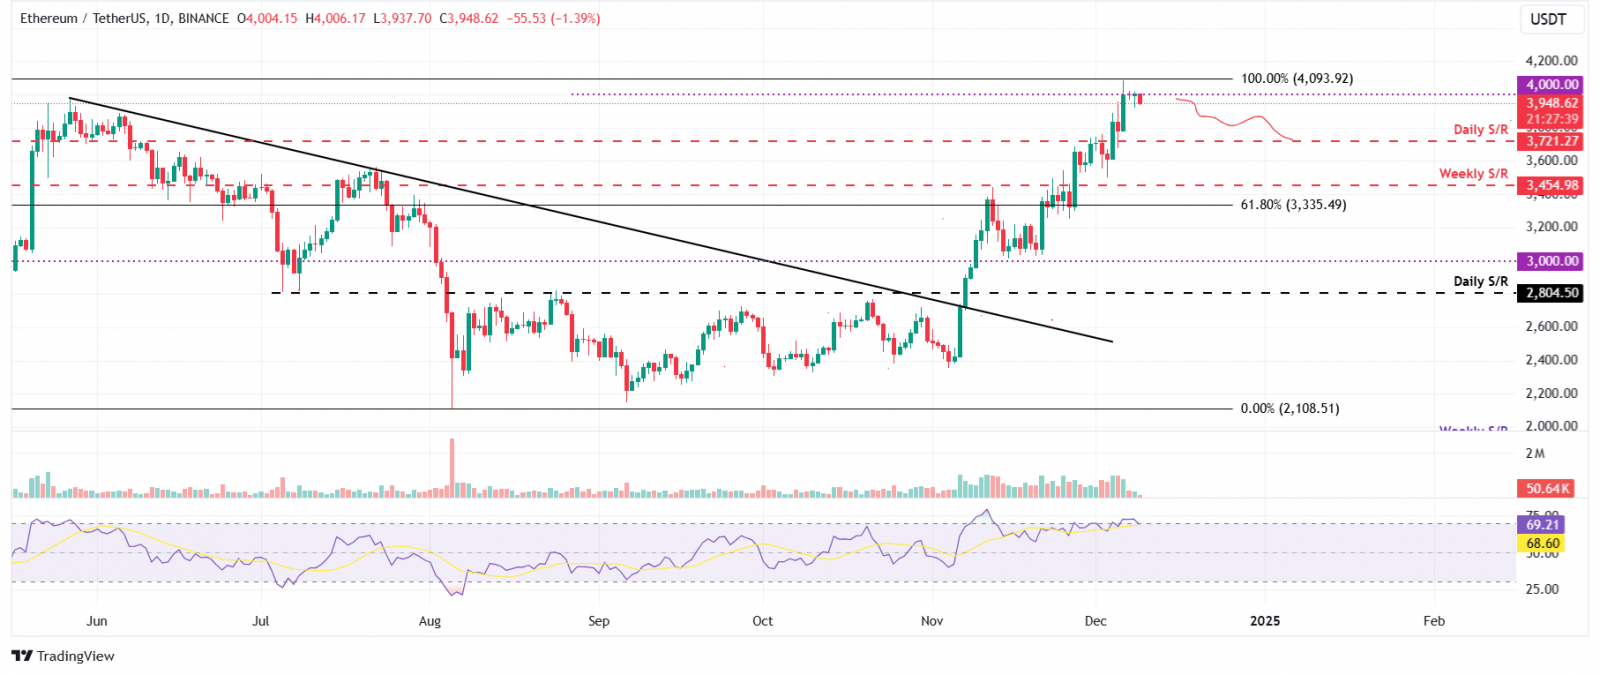
Ethereum price rallied 8% last week and retested the $4,000 level on Friday. However, it faced resistance around this level during the weekend. At the time of writing on Monday, it trades down around $3,948.
If the $4,000 continues to hold as resistance, ETH could extend the decline to retest its daily support level at $3,721.
The RSI on the daily chart reads 69 and points downwards after rejecting the overbought level of 70, suggesting weakness in bullish momentum.

ETH/USDT daily chart
However, if ETH rallies and closes above $4,000, it could extend the rally to retest the $4,200 level.
Ripple price is set for a downturn
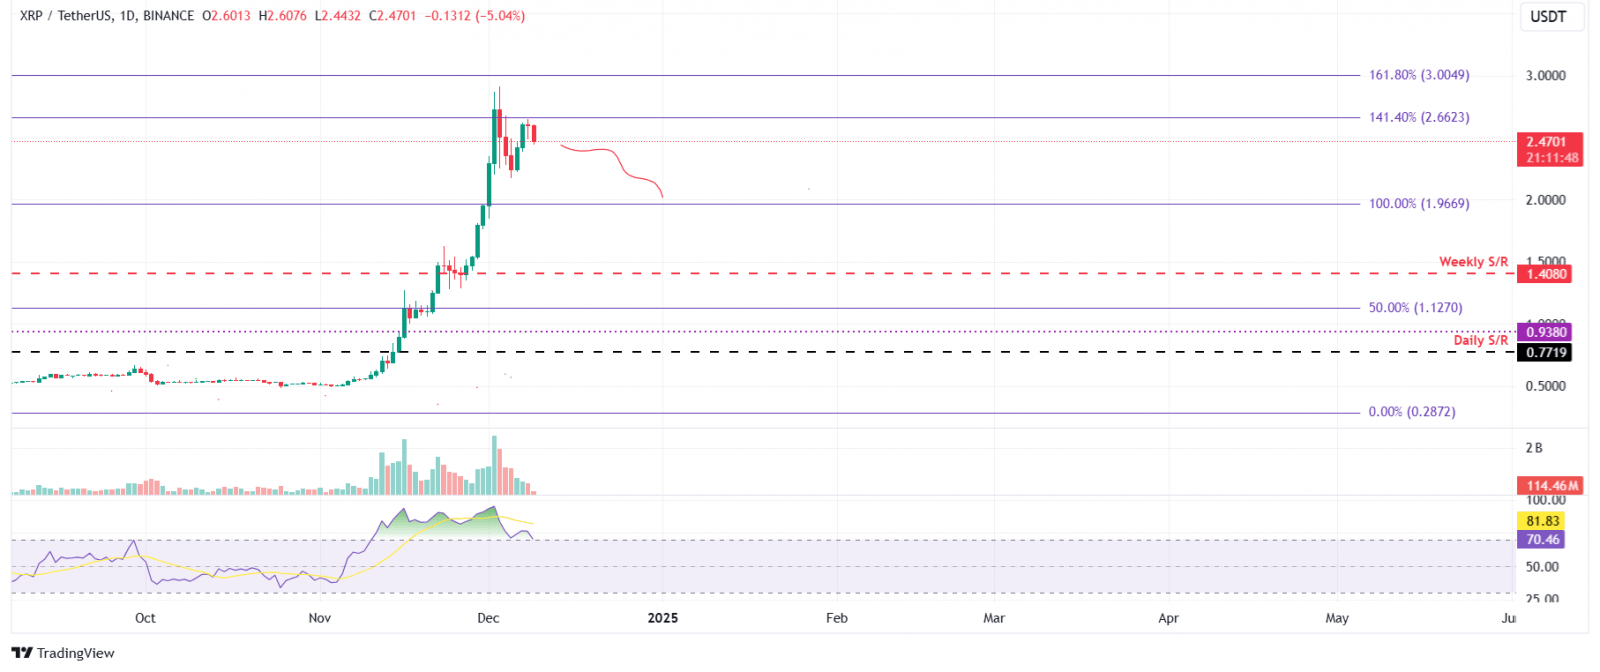
Ripple price faces resistance around the $2.66 level on Sunday. At the time of writing on Monday, it trades slightly down around $2.47.
If the $2.66 level continues to hold as resistance, XRP could extend the decline to retest the psychologically important level of $2.00.
The RSI on the daily chart reads 70, hovering around the overbought level of 70, and points downwards, indicating weakness in bullish momentum. If the RSI exits overbought territory, it could provide a clear sell signal.

XRP/USDT daily chart
On the other hand, if XRP rallies and closes above the $2.66 level, it could extend the rally to retest the psychologically important level of $3.00.
Share: Cryptos feed


 Bitcoin
  Ethereum
  Tether
  Dogecoin
  USDC
USDC  Cardano
  TRON
TRON  Chainlink
  Stellar
  Hedera
  Bitcoin Cash
  LEO Token
  Litecoin
  Cronos
  Ethereum Classic
  Monero
  Dai
Dai  Algorand
  OKB
OKB  Cosmos Hub
  Stacks
  Theta Network
  Gate
Gate  Maker
Maker  KuCoin
  Tezos
Tezos  IOTA
IOTA  NEO
NEO  Polygon
  Zcash
Zcash  Synthetix Network
  Tether Gold
  TrueUSD
  Dash
Dash  Holo
Holo  Zilliqa
  Enjin Coin
  0x Protocol
  Siacoin
  Qtum
Qtum  Basic Attention
  Ravencoin
  Bitcoin Gold
  Decred
  NEM
NEM  DigiByte
  Ontology
  Nano
Nano  Status
  Waves
Waves  Huobi
Huobi  Lisk
Lisk  Hive
Hive  Numeraire
  Steem
Steem  Pax Dollar
  BUSD
BUSD  OMG Network
  Ren
Ren  Bitcoin Diamond
  Bytom
Bytom