Solana (SOL) Price Shows Signs of Recovery After 27% Correction

Solana (SOL) price reached a new all-time high on November 22 but has been in a corrective phase since, currently trading 27% below that peak. Recent technical indicators highlight mixed signals, with bearish momentum showing signs of easing but still dominating the market.
The BBTrend, though improving from its recent low, remains in negative territory, while the DMI suggests that the current downtrend is losing strength. As SOL hovers near critical resistance at $195, its price trajectory will depend on whether bullish signals gain traction or bearish pressure intensifies.
SOL BBTrend Is Still Very Negative
Solana BBTrend recently reached its lowest level since August, hitting -18.89 on December 22. It has remained in negative territory since December 21.
Currently at -14.64, the BBTrend shows signs of improvement, indicating a potential shift in market sentiment. This upward move, while still in the negative zone, suggests that selling pressure might be easing as buyers begin to re-enter the market cautiously.

SOL BBTrend. Source: TradingView
BBTrend, or Bollinger Band Trend, is a momentum indicator derived from Bollinger Bands. It measures the difference between an asset’s price and the midpoint of its Bollinger Bands, providing insights into trend strength and direction. Negative BBTrend values indicate bearish momentum, while positive values suggest bullish trends.
With SOL BBTrend rising from -18.89 to -14.64, it implies that bearish momentum is weakening, potentially setting the stage for a price recovery in the short term. However, until BBTrend crosses into positive territory, the market may remain cautious, with the price movement likely subdued or range-bound.
Solana DMI Shows an Uptrend Could Appear Soon
The Solana Directional Movement Index (DMI) chart reveals that its Average Directional Index (ADX) is currently at 34, a sharp decline from nearly 50 just a day ago. While an ADX above 25 still signals a strong trend, the recent drop suggests that the strength of SOL’s current downtrend is weakening.
This decrease in trend strength comes as SOL continues to exhibit bearish price action, but the diminishing ADX could indicate that selling momentum is starting to fade.

SOL DMI. Source: TradingView
ADX, a key component of the DMI, measures trend strength on a scale from 0 to 100 without specifying the direction. Values above 25 signify a strong trend, while those below 20 suggest weak or absent trends. Meanwhile, the positive directional indicator (D+) at 19.34 and the negative directional indicator (D-) at 19.81 reflect near-equal pressures from buyers and sellers, with a slight bearish dominance.
This combination of a declining ADX and nearly balanced D+ and D- suggests that while SOL remains in a downtrend, the bearish momentum may be losing steam. In the short term, this could lead to a consolidation phase or a potential reversal if buyer strength gains traction.
SOL Price Prediction: Back to $200 In December?
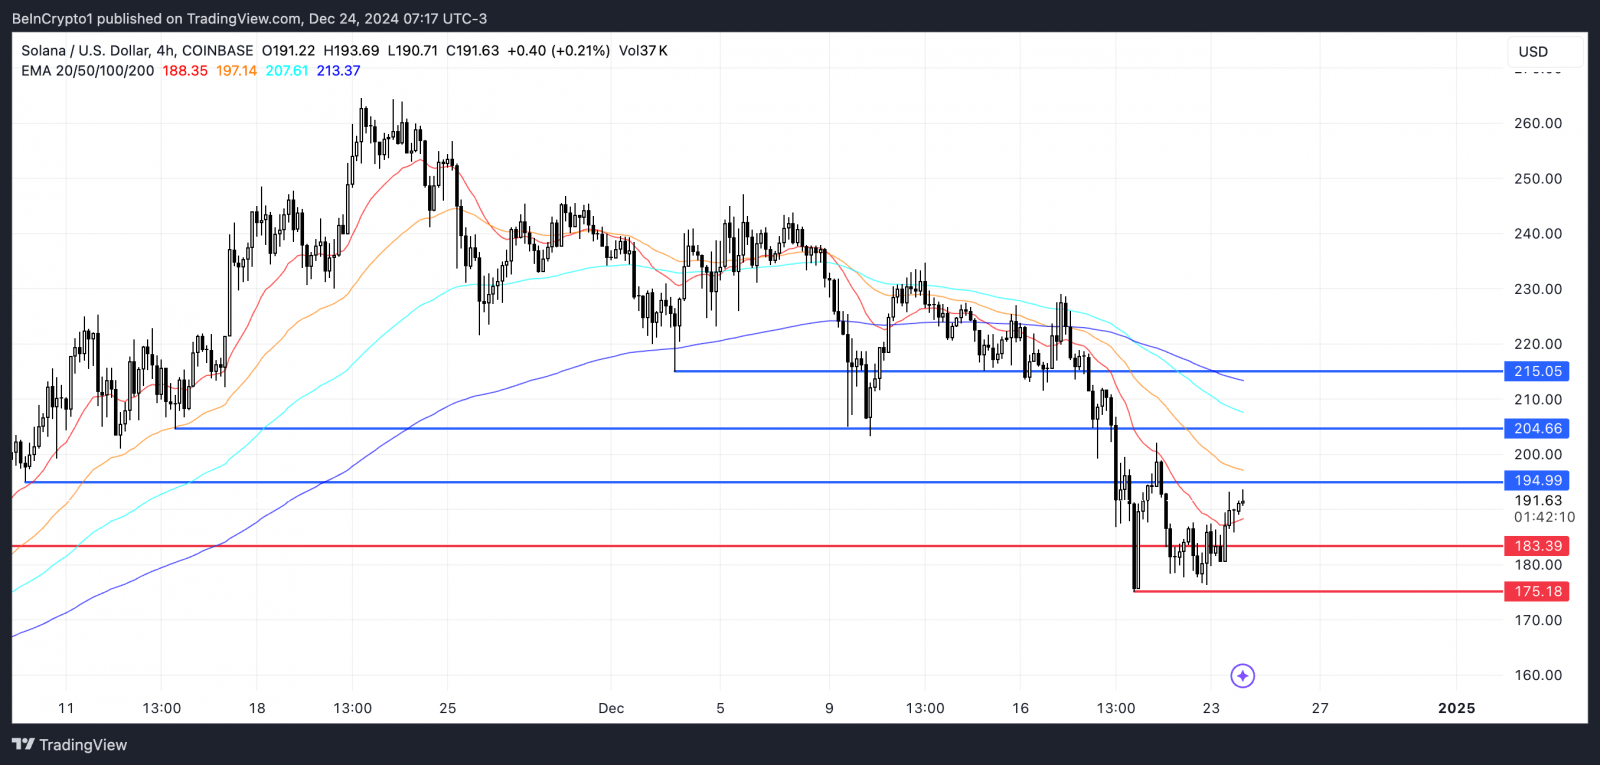
SOL price closest resistance around $195 is shaping up to be a critical level for its upcoming price movements. Currently, the Exponential Moving Average (EMA) lines are in a bearish configuration, with short-term lines below long-term ones.
However, the recent upward shift in short-term EMAs hints at a possible golden cross, a bullish signal that could indicate a trend reversal.

SOL Price Analysis. Source: TradingView
If Solana price successfully breaks the $195 resistance, it could target $204 next, with the potential to climb further to $215, marking a significant recovery.
On the downside, if the BBTrend remains deeply negative and the ongoing downtrend gains strength, SOL price could retest the $183 support level. A failure to hold this support could lead to a further decline, with the price potentially dropping to $175.


 Bitcoin
  Ethereum
  Tether
  Dogecoin
  USDC
USDC  Cardano
  TRON
TRON  Chainlink
  Hedera
  Stellar
  Bitcoin Cash
  LEO Token
  Litecoin
  Cronos
  Ethereum Classic
  Monero
  Dai
Dai  Algorand
  OKB
OKB  Cosmos Hub
  Stacks
  Theta Network
  Gate
Gate  Maker
Maker  Tezos
Tezos  KuCoin
  Zcash
Zcash  IOTA
IOTA  NEO
NEO  Polygon
  Synthetix Network
  Tether Gold
  Dash
Dash  TrueUSD
  Holo
Holo  Zilliqa
  0x Protocol
  Enjin Coin
  Basic Attention
  Qtum
Qtum  Siacoin
  Ravencoin
  Decred
  Bitcoin Gold
  NEM
NEM  Ontology
  DigiByte
  Nano
Nano  Huobi
Huobi  Status
  Lisk
Lisk  Waves
Waves  Hive
Hive  Numeraire
  Steem
Steem  Pax Dollar
  BUSD
BUSD  OMG Network
  Ren
Ren  Bitcoin Diamond