Bitcoin (BTC) Fall Continues Below $40,000 – Will Price Bounce Soon?

The Bitcoin (BTC) price has fallen significantly since January 11, decreasing below $40,000 this week.
So far, the downward movement is the second largest since the start of 2023. When will Bitcoin bottom?
Bitcoin Creates Bearish Candlestick
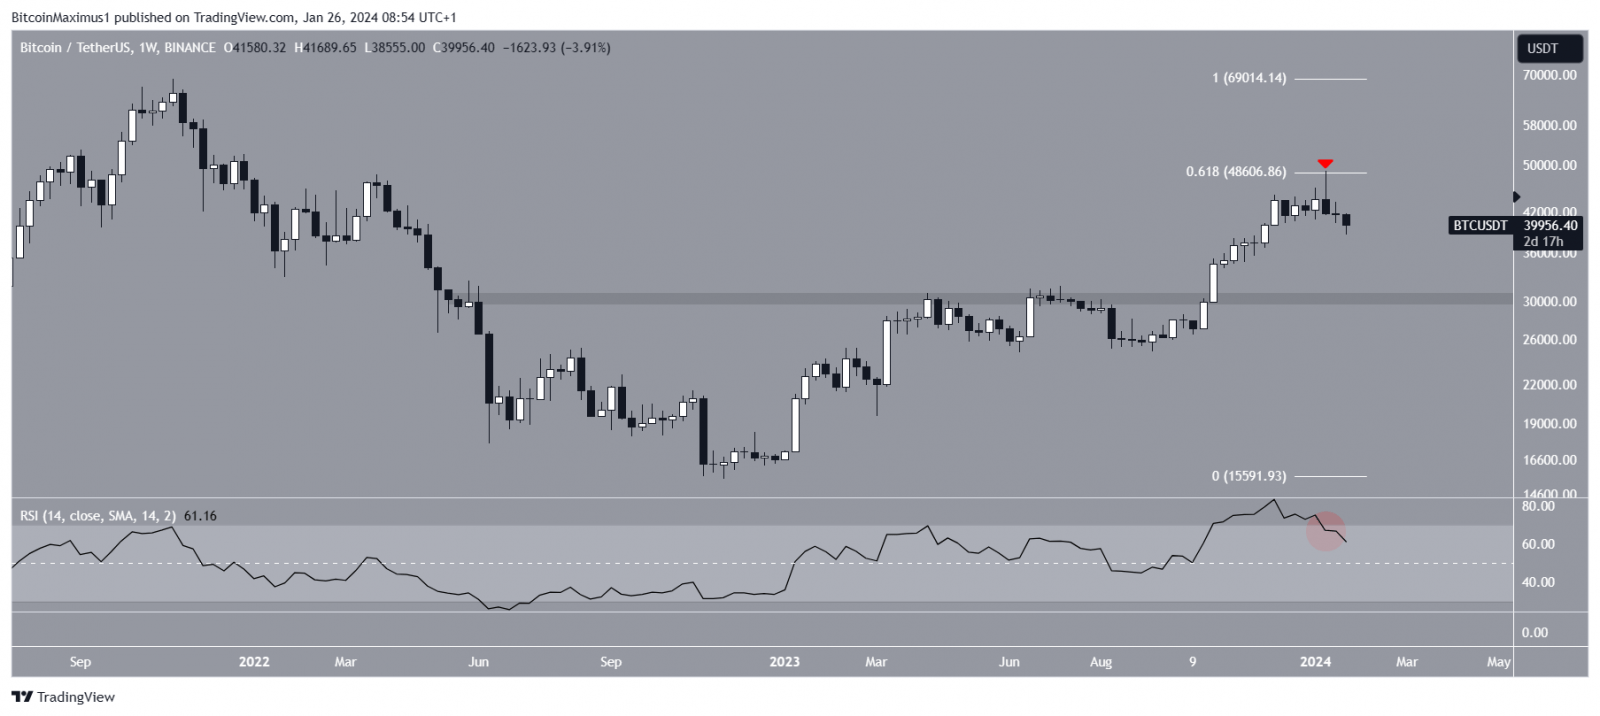
The technical analysis of the weekly time frame shows that the BTC price has increased since the start of 2023. The upward movement culminated with a high of $48,969 the week of the ETF approval.
However, the BTC price has fallen, creating a bearish weekly candlestick (red icon). The high was made right at the 0.618 Fib retracement resistance level. Bitcoin has fallen since, decreasing below $40,000 this week.

BTC/USDT Weekly Chart. Source: TradingView
The weekly Relative Strength Index (RSI) gives a bearish reading. Market traders use the RSI as a momentum indicator to identify overbought or oversold conditions and to decide whether to accumulate or sell an asset.
Readings above 50 and an upward trend indicate that bulls still have an advantage, whereas readings below 50 suggest the opposite. The indicator decreased below 70 (red circle) and is moving downward.
What Are Analysts Saying?
Cryptocurrency analysts and traders on X are mostly bearish on the short-term BTC trend.
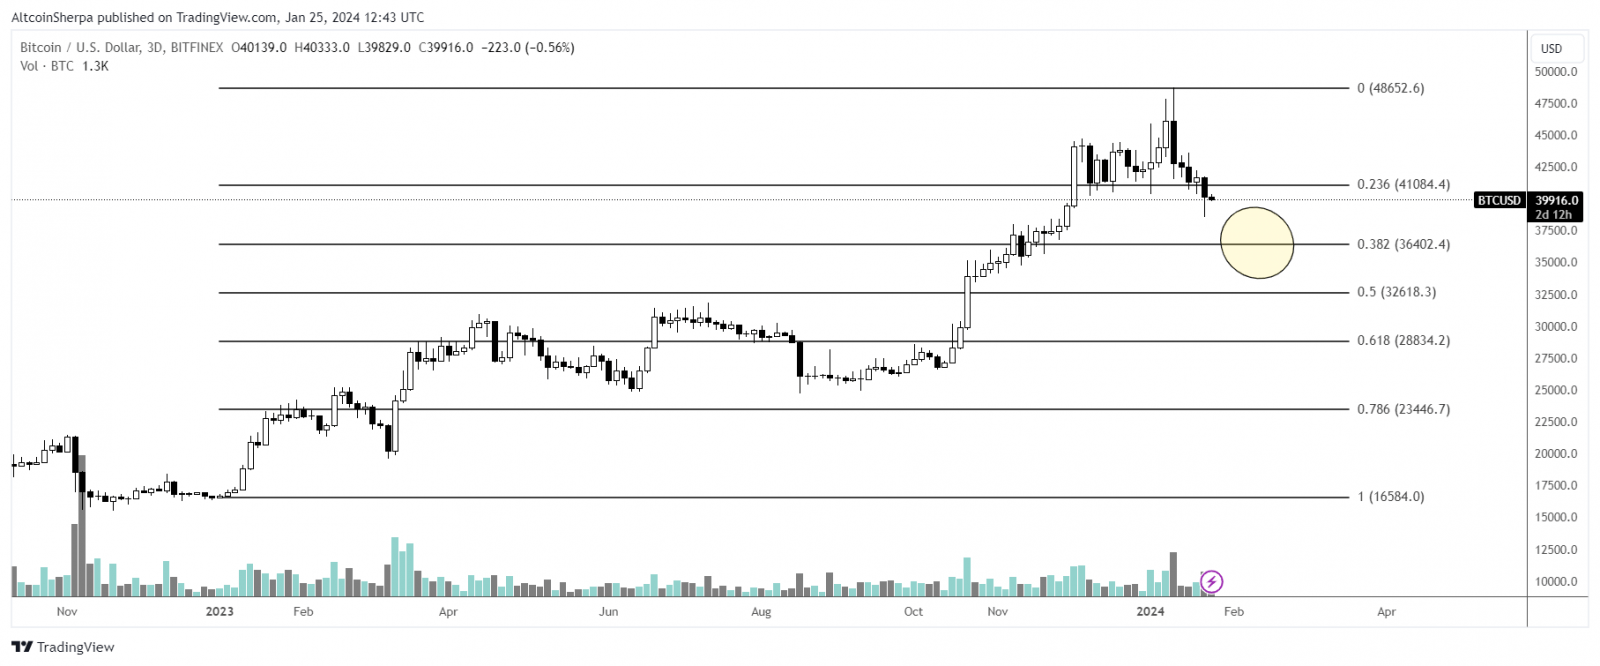
Altcoin Sherpa believes BTC will fall until reaching the 0.382 Fib retracement support level at $36,400.

BTC/USDT 3-Day Chart. Source: X
CredibullCrypto and TheTradingHubb are both bearish because of the wave count, suggesting that one more low is in store. The former tweeted:
Meant to go over LTF $BTC count in my last vid update but forgot to cover it, so here’s a chart. Further supports the idea of one more small push down before our full-on reversal.
However, IncomeSharks goes against the crowded opinion, suggesting that BTC will increase in the short-term to $44,000.
BTC Price Prediction: When Will the Price Bottom?
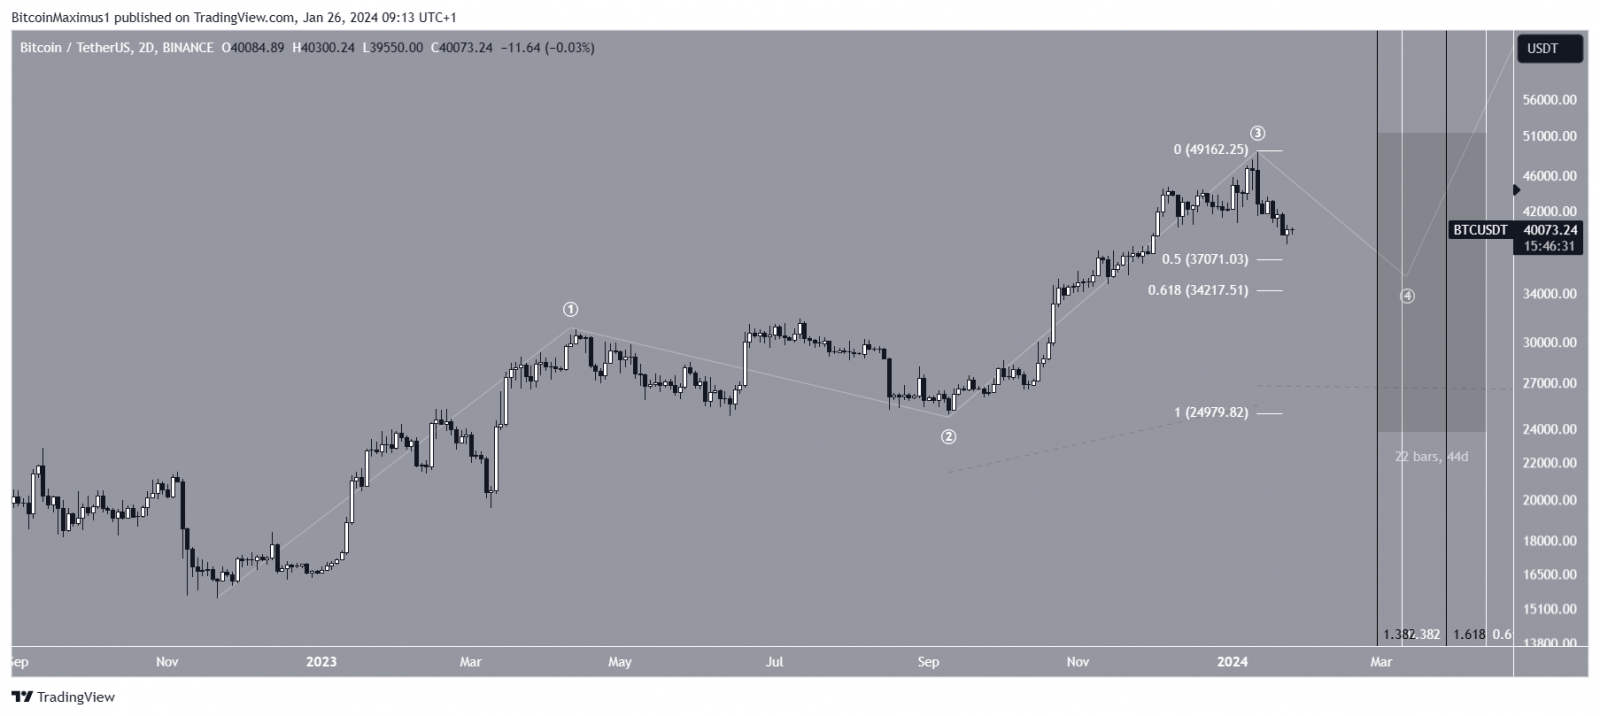
A closer look at the technical analysis from the 2-day time frame suggests that the BTC price will still be correct because of the wave count.
Technical analysts utilize the Elliott Wave theory to ascertain the trend’s direction by studying recurring long-term price patterns and investor psychology. The most likely count states that BTC is in wave four in a five-wave upward movement (white).
Based on the lengths of waves two and three, the correction will likely end in March – April (highlighted
Also, since waves two and four need to alternate with each other, wave four will likely be sharp, reaching the 0.5-0.618 Fib retracement support levels at $37,100 – $34,200.

BTC/USDT 2-Day Chart. Source: TradingView
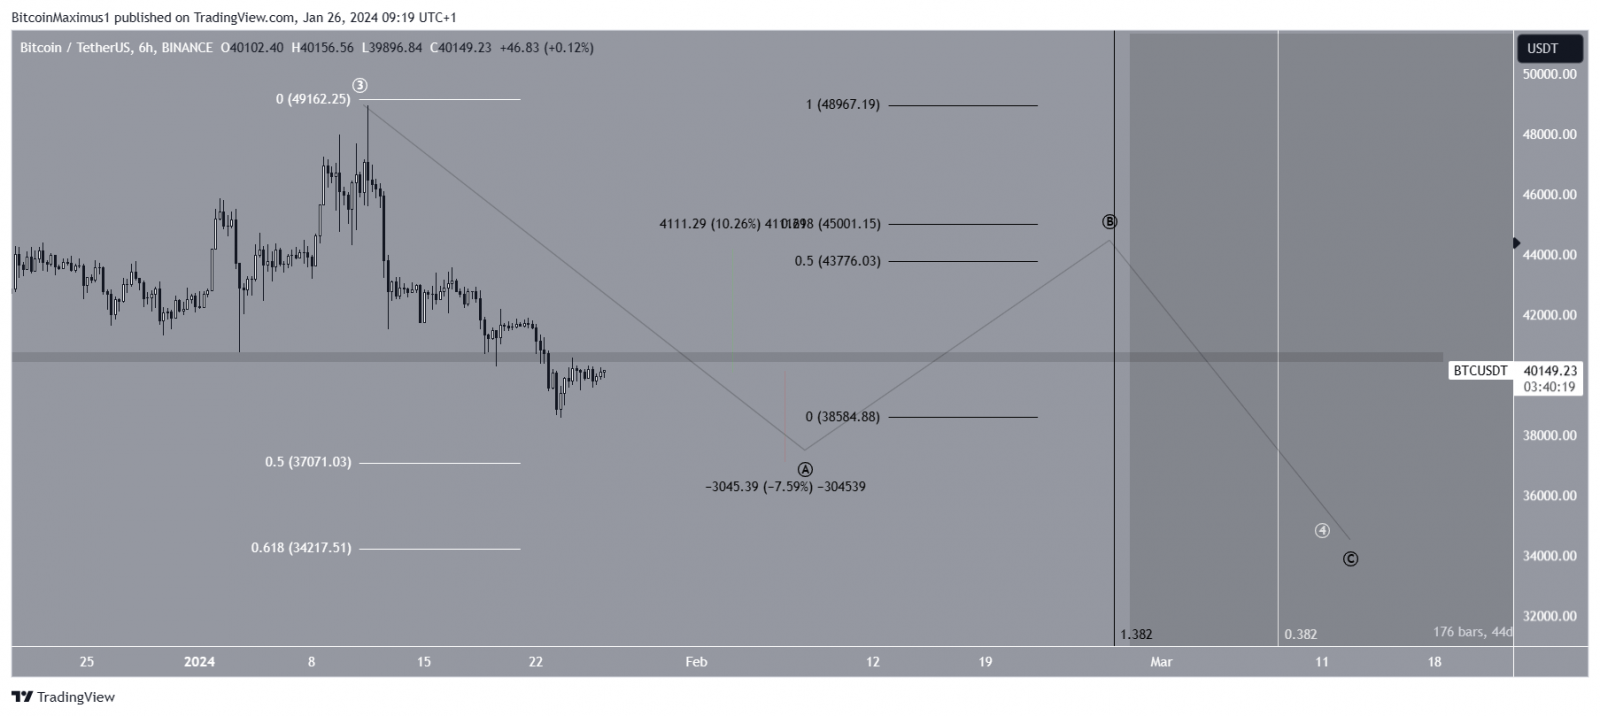
The sub-wave count (black) suggests that BTC is still correcting in wave A of an A-B-C corrective structure. If the count is correct, BTC will fall by another 8% to the 0.5 Fib retracement support level at $37,100 before bouncing.

BTC/USDT Six-Hour Chart. Source: TradingView
Despite this bearish BTC price prediction, reclaiming the $31,00 resistance area will mean the local bottom is in. Then, the price can increase by 10% to the closest resistance between $43,800-$45,000.
For BeInCrypto‘s latest crypto market analysis, click here.
Disclaimer
In line with the Trust Project guidelines, this price analysis article is for informational purposes only and should not be considered financial or investment advice. BeInCrypto is committed to accurate, unbiased reporting, but market conditions are subject to change without notice. Always conduct your own research and consult with a professional before making any financial decisions. Please note that our Terms and Conditions, Privacy Policy, and Disclaimers have been updated.


 Bitcoin
  Ethereum
  Tether
  Dogecoin
  USDC
USDC  Cardano
  TRON
TRON  Chainlink
  Stellar
  Hedera
  Bitcoin Cash
  LEO Token
  Litecoin
  Cronos
  Ethereum Classic
  Monero
  Dai
Dai  Algorand
  OKB
OKB  Cosmos Hub
  Stacks
  Theta Network
  Gate
Gate  Maker
Maker  KuCoin
  Tezos
Tezos  IOTA
IOTA  NEO
NEO  Polygon
  Zcash
Zcash  Synthetix Network
  Tether Gold
  TrueUSD
  Dash
Dash  Holo
Holo  Zilliqa
  Enjin Coin
  0x Protocol
  Siacoin
  Qtum
Qtum  Basic Attention
  Ravencoin
  Bitcoin Gold
  Decred
  NEM
NEM  DigiByte
  Ontology
  Nano
Nano  Status
  Waves
Waves  Huobi
Huobi  Lisk
Lisk  Hive
Hive  Numeraire
  Steem
Steem  Pax Dollar
  BUSD
BUSD  OMG Network
  Ren
Ren  Bitcoin Diamond
  Bytom
Bytom