Bitcoin (BTC) Price Prepares for Next Potential Surge After Recent High

Bitcoin (BTC) price has shown shifts in sentiment after recently reaching a very close level to its all-time high. DMI highlights a softening in BTC’s uptrend momentum, suggesting some pullback in buying intensity.
Similarly, while NUPL remains in a positive phase, it reveals a more cautious outlook among holders compared to the euphoria levels seen in past cycles. Together with BTC’s price chart, these indicators suggest a period of consolidation or minor correction before any potential move to new highs.
BTC DMI Shows Sentiment Recently Changed
The BTC DMI chart reveals that its ADX is now at 29.26, down from over 40 days ago. ADX, or the Average Directional Index, measures trend strength without showing direction.
An ADX above 25 indicates a strong trend, while values below 20 suggest a weak or non-existent trend. With ADX moving lower from above 40, the strength of BTC’s recent uptrend has softened.
Read more: 7 Best Crypto Exchanges in the USA for Bitcoin (BTC) Trading

BTC DMI. Source: TradingView
DMI uses two lines, D+ and D-, to indicate the direction of the trend. BTC’s D+ currently stands at 20.6, while D- is at 24.5. This suggests sellers are momentarily stronger than buyers.
However, just a few days ago, BTC was in a stronger uptrend, with D+ above 40 and D- around 10, showing that buying pressure far outweighed selling. Though BTC price is technically in an uptrend, the balance between buying and selling forces has shifted slightly, with D- edging higher than D+.
Bitcoin NUPL Is Far From The Euphoria Level
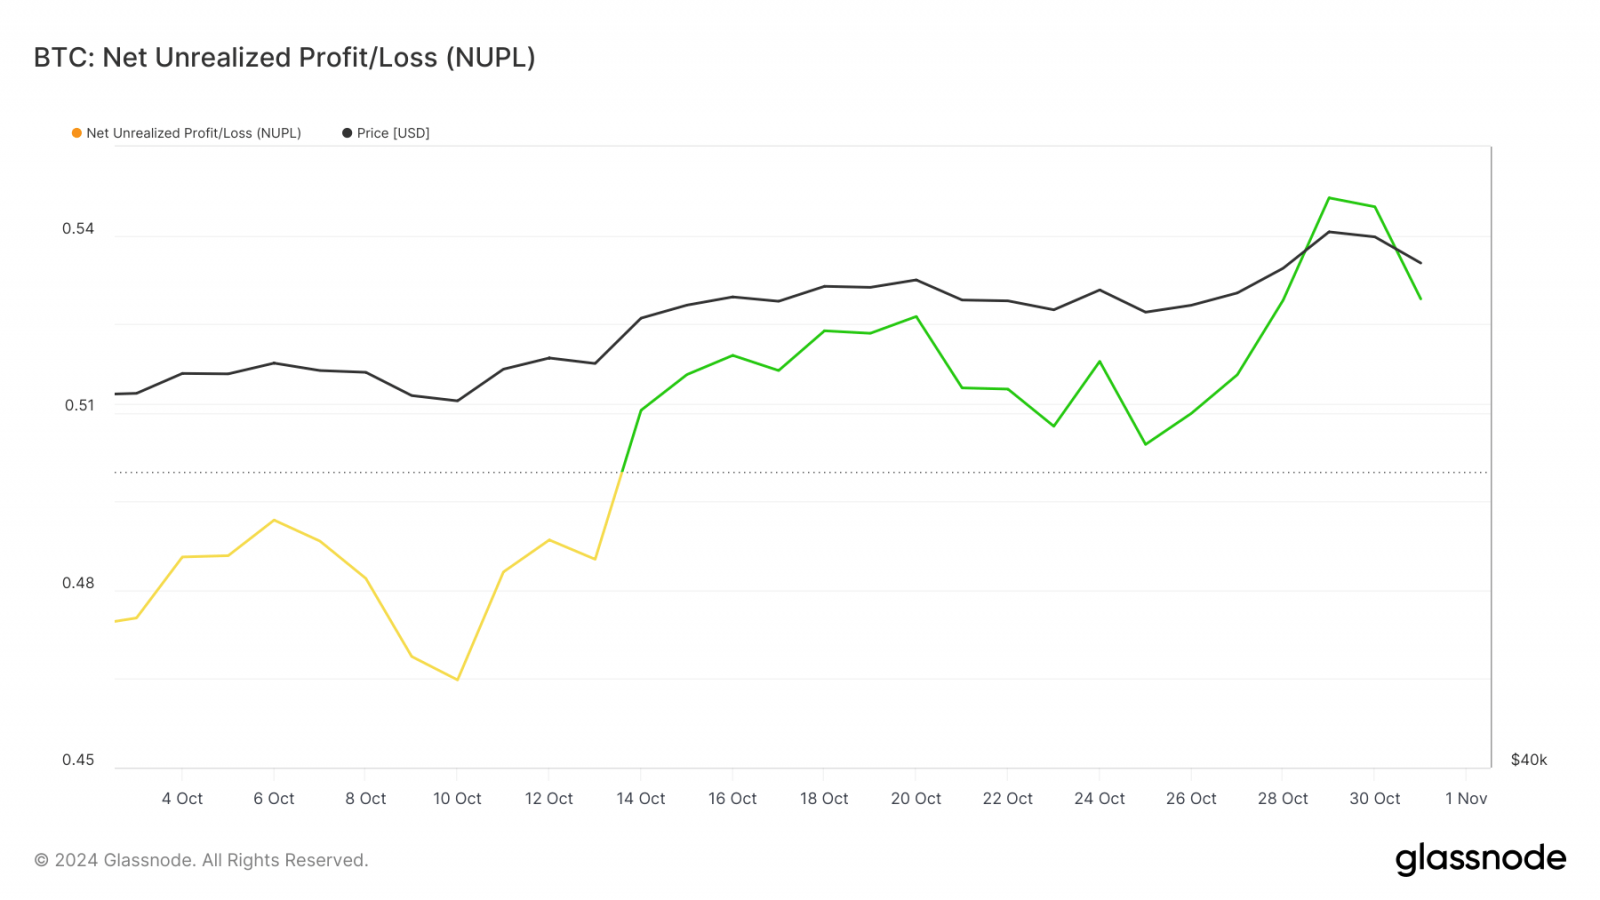
BTC’s NUPL is currently at 0.529, slightly lower than the 0.546 level reached a few days ago. This drop indicates a modest decline in unrealized profit among holders, reflecting some recent profit-taking or a pause in overall market optimism.
Despite the decrease, BTC’s NUPL remains positive, meaning most holders are still in profit but are approaching a more cautious sentiment.

BTC NUPL. Source: Glassnode
NUPL, or Net Unrealized Profit/Loss, is a metric that calculates the difference between unrealized gains and losses among holders, indicating general market sentiment.
Although BTC’s NUPL has dipped, it still sits in the belief-denial phase and is currently well below the euphoria-greed level where extreme optimism historically occurs.
BTC Price Prediction: A Stronger Correction Before a New All-Time High?
BTC’s price chart shows its short-term EMA lines positioned above the long-term EMAs, indicating a bullish trend. This alignment suggests stronger recent momentum compared to the longer-term trend, often a sign of increased buying interest and positive sentiment, potentially setting up further gains.
Read more: Bitcoin (BTC) Price Prediction 2024/2025/2030

BTC EMA Lines and Support and Resistance. Source: TradingView
However, the narrowing gap between the EMAs signals that bullish momentum has slowed in recent days. If the uptrend regains strength, BTC could aim for new highs above $73,618. Conversely, BTC may first pull back to test support at $65,503; if this level fails, a dip to $62,043, marking an 11.4% correction, could follow.


 Bitcoin
  Ethereum
  Tether
  Dogecoin
  USDC
USDC  Cardano
  TRON
TRON  Chainlink
  Stellar
  Hedera
  Bitcoin Cash
  LEO Token
  Litecoin
  Cronos
  Ethereum Classic
  Monero
  Dai
Dai  Algorand
  OKB
OKB  Cosmos Hub
  Stacks
  Theta Network
  Gate
Gate  Maker
Maker  Tezos
Tezos  KuCoin
  IOTA
IOTA  NEO
NEO  Zcash
Zcash  Polygon
  Synthetix Network
  Tether Gold
  TrueUSD
  Dash
Dash  Holo
Holo  Zilliqa
  Enjin Coin
  0x Protocol
  Qtum
Qtum  Basic Attention
  Siacoin
  Ravencoin
  Bitcoin Gold
  Decred
  NEM
NEM  DigiByte
  Ontology
  Nano
Nano  Hive
Hive  Waves
Waves  Status
  Huobi
Huobi  Lisk
Lisk  Numeraire
  Steem
Steem  Pax Dollar
  BUSD
BUSD  OMG Network
  Ren
Ren  Bitcoin Diamond
  Bytom
Bytom