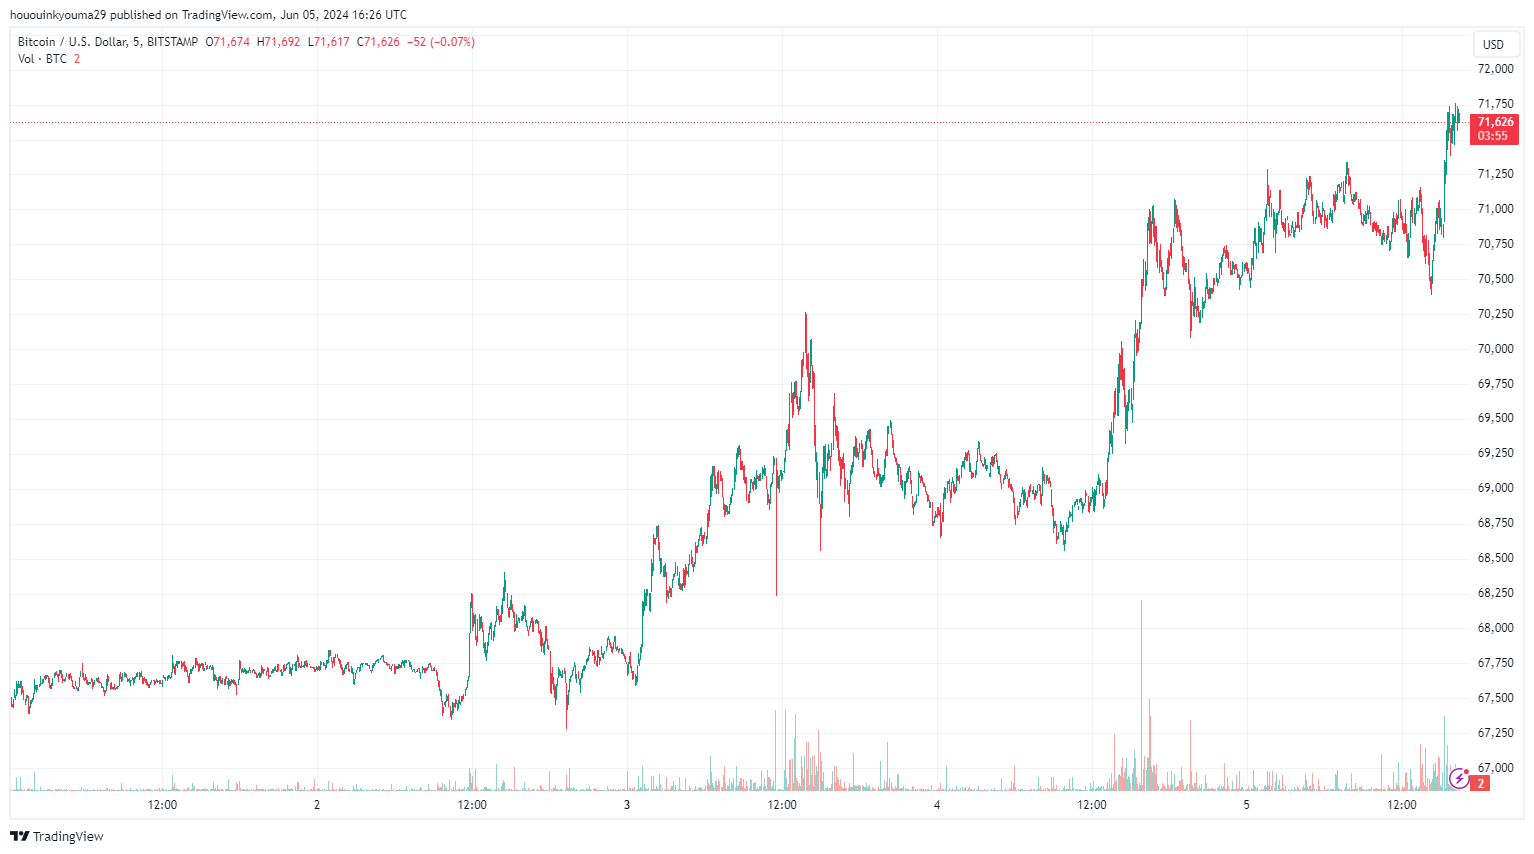
Bitcoin Surges Past $71,000, But TD Sequential Says ‘Sell’

The Tom Demark (TD) Sequential has given a sell signal for Bitcoin after the asset broke past the $71,000 level in the past day.
Bitcoin TD Sequential Is Giving A Sell Signal Right Now
As explained by analyst Ali Martinez in a new post on X, a TD Sequential signal has appeared in the 1-hour price of Bitcoin. The “TD Sequential” refers to an indicator in technical analysis (TA) that’s generally used for locating probable points of reversal in any commodity’s price.
The TD Sequential involves two phases: setup and countdown. During the first of these, candles of the same polarity (that is, whether red or green) are counted to nine. After these nine candles are in, the asset may be assumed to have encountered a turnaround.
Naturally, if the candles leading up to the setup’s completion were red, the TD Sequential would give a buy signal for the asset. On the other hand, green candles would imply a potential reversal towards the downside.
After the setup is over, the countdown phase begins. This second phase of the indicator is much like the first one, except for the fact that the number of candles to be counted here is thirteen rather than nine. The countdown’s completion implies that the price has encountered another likely point of reversal.
A TD Sequential phase of the former type has recently been completed in the 1-hour price of Bitcoin. Below is the chart shared by Ali that shows this pattern in cryptocurrency.
From the graph, it’s visible that TD Sequential has recently finished its setup phase with green candles for Bitcoin. This signal comes as the coin has surged beyond the $71,000 level for the first time since mid-May.
This TD setup would mean that the party could already be over for now as the coin may have reached a local top, and a reversal to the down direction could be coming.
While the TD Sequential could spell a worry for BTC in the short-term, another TA indicator could point towards a bullish outcome for the asset instead. As CryptoQuant author Axel Adler Jr has pointed out in an X post, the Bitcoin Relative Strength Index (RSI) is at a level where recent uptrends have begun.

The RSI tracks the magnitude of recent changes in the price of any given asset. As the chart shows, the 14-day RSI currently has a value of 56% for BTC.
Usually, the price is considered to be undervalued when this metric drops below 30%. Strangely, the last three major uptrends in BTC began when the RSI had a value of 56%. This could be a coincidence, but BTC could see a sharp surge soon if it’s truly a pattern.
BTC Price
Despite the appearance of the TD Sequential, Bitcoin hasn’t let off yet, as the asset has climbed beyond $71,600.

Featured image from Dall-E, CryptoQuant.com, charts from TradingView.com


 Bitcoin
  Ethereum
  Tether
  USDC
USDC  Dogecoin
  TRON
TRON  Cardano
  Chainlink
  Bitcoin Cash
  LEO Token
  Litecoin
  Dai
Dai  Monero
  Stellar
  Ethereum Classic
  Stacks
  OKB
OKB  Cronos
  Hedera
  Cosmos Hub
  Theta Network
  Gate
Gate  KuCoin
  Maker
Maker  Algorand
  Polygon
  Tether Gold
  EOS
EOS  NEO
NEO  Tezos
Tezos  Zcash
Zcash  TrueUSD
  Synthetix Network
  Bitcoin Gold
  IOTA
IOTA  Holo
Holo  Dash
Dash  Zilliqa
  0x Protocol
  Siacoin
  Enjin Coin
  Ravencoin
  Basic Attention
  Qtum
Qtum  Decred
  Ontology
  NEM
NEM  Lisk
Lisk  Pax Dollar
  Nano
Nano  Waves
Waves  Numeraire
  DigiByte
  Status
  Huobi
Huobi  Hive
Hive  Steem
Steem  BUSD
BUSD  Ren
Ren  OMG Network
  Bitcoin Diamond
  Bytom
Bytom  Kyber Network Crystal Legacy
  HUSD
HUSD