Bitcoin Technical Analysis: $100K in Sight as Bulls Battle Key Resistance Levels

Bitcoin, currently coasting along at $96,566 to $96,751 over the last hour, with a 24-hour volume of $27.76 billion and a market valuation of $1.92 trillion, has been bouncing between $93,444 and $96,794, hinting at exciting volatility according to technical indicators.
Bitcoin
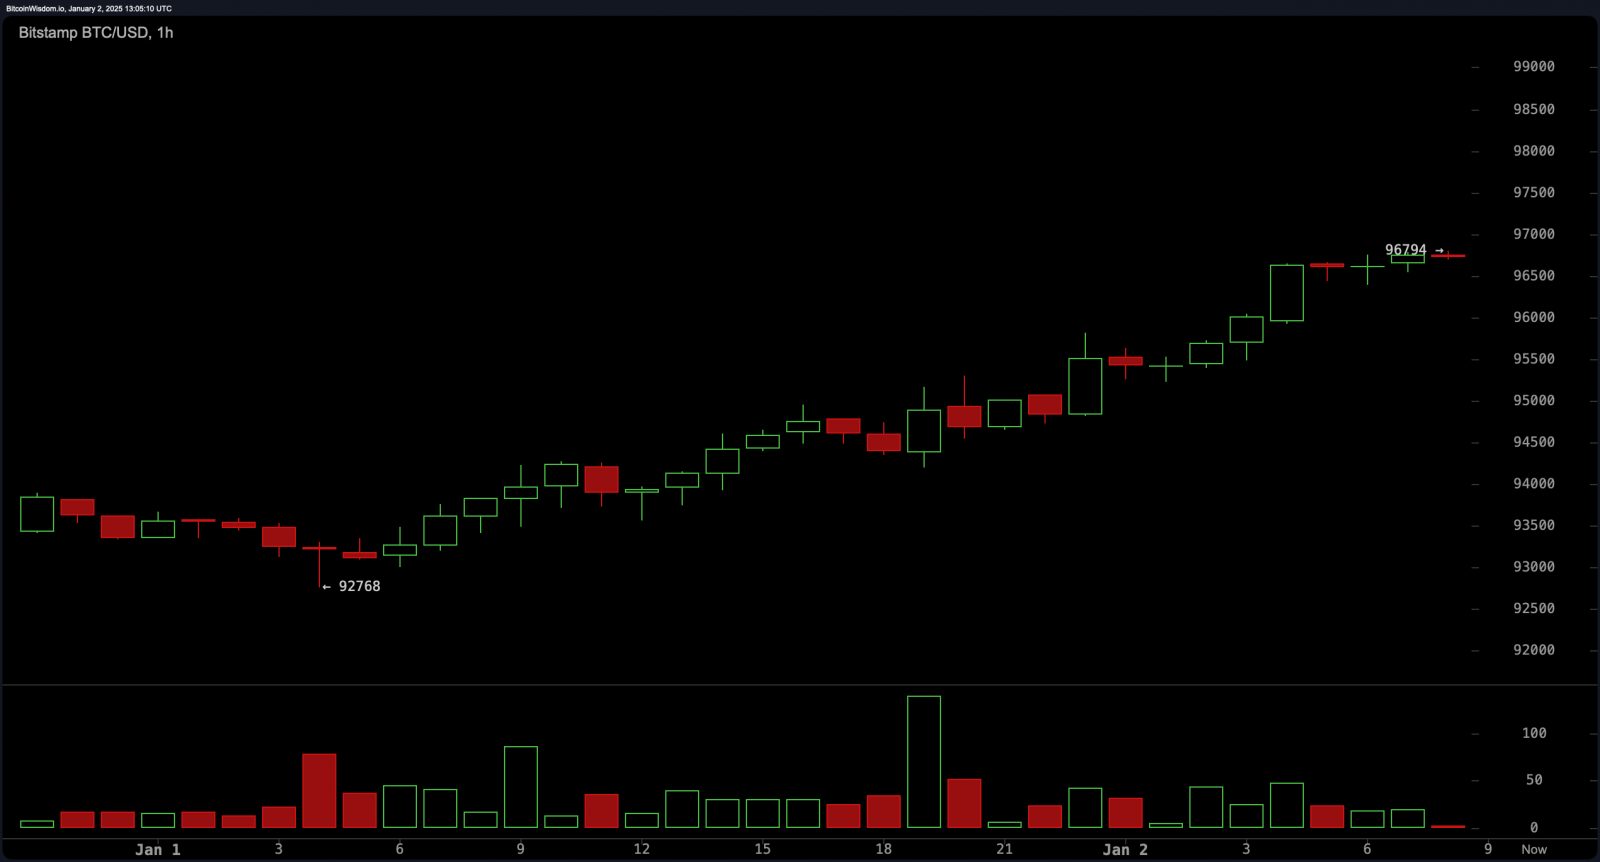
On the hourly chart, bitcoin‘s price has been on an impressive upward climb from $92,768 to $96,794, now taking a little breather. This chill near resistance levels hints at an upcoming breakout or a slight backtrack, with support at $95,800 and resistance waiting at $97,500. Volume spikes during these ascents point to a flurry of activity, possibly from those cashing in or making strategic moves.

BTC/USD 1H chart on Jan. 2, 2024.
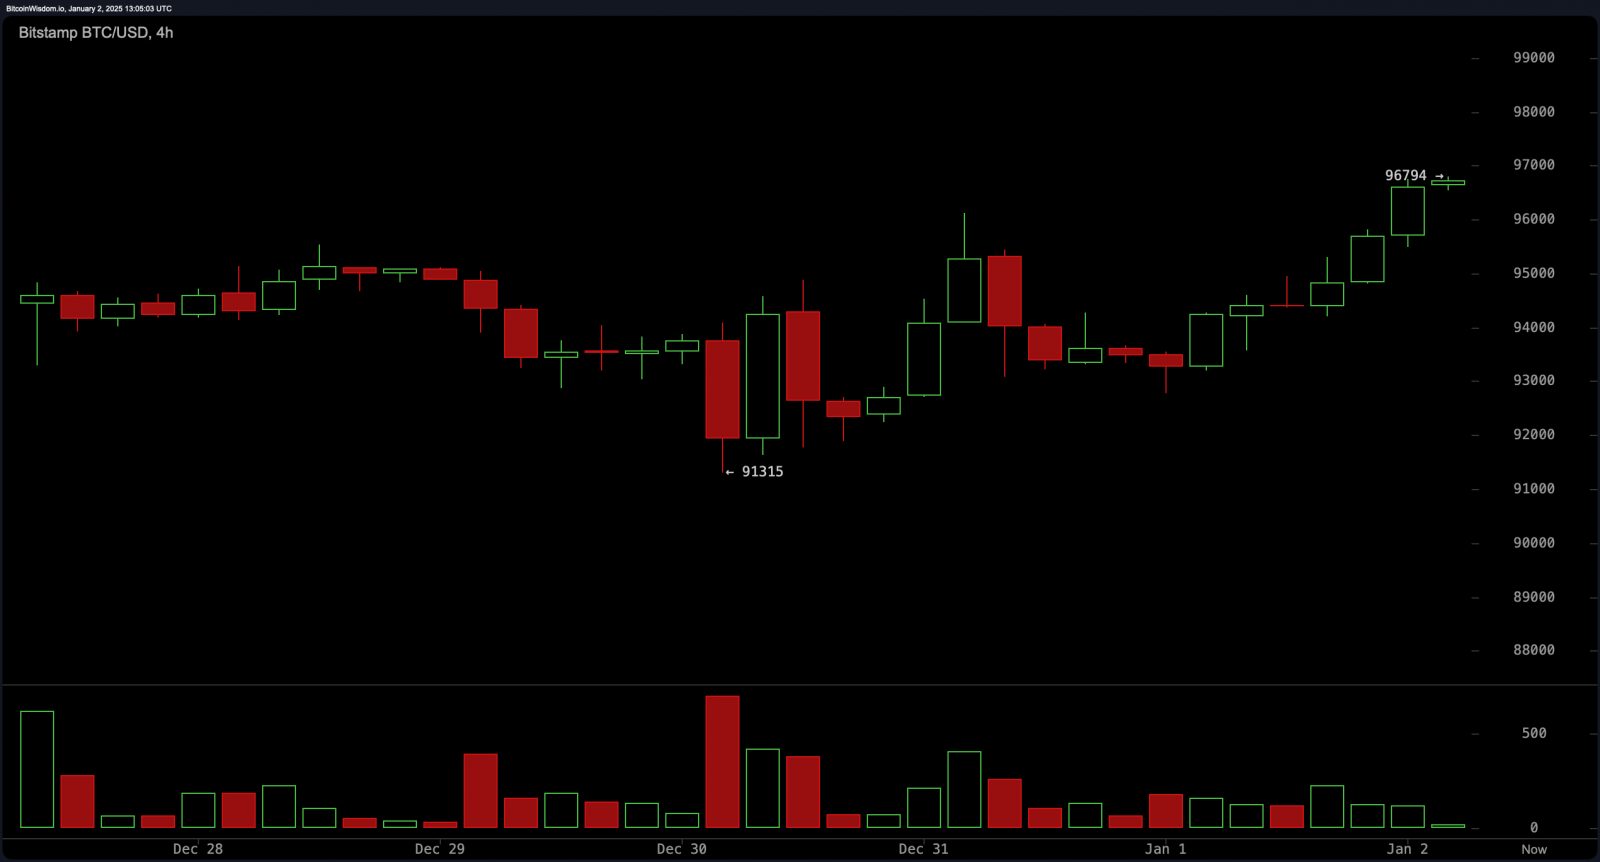
Switching to the 4-hour chart, bitcoin’s recovery from $91,000 to $96,794 is bolstered by consistent higher lows and an upbeat momentum. Key levels to watch are $94,500 for support and $97,500 to $98,000 for resistance, coinciding with noticeable volume upticks around these markers. The price action shows a recovery within a wider range, buoyed by heightened interest at crucial points.

BTC/USD 4H chart on Jan. 2, 2024.
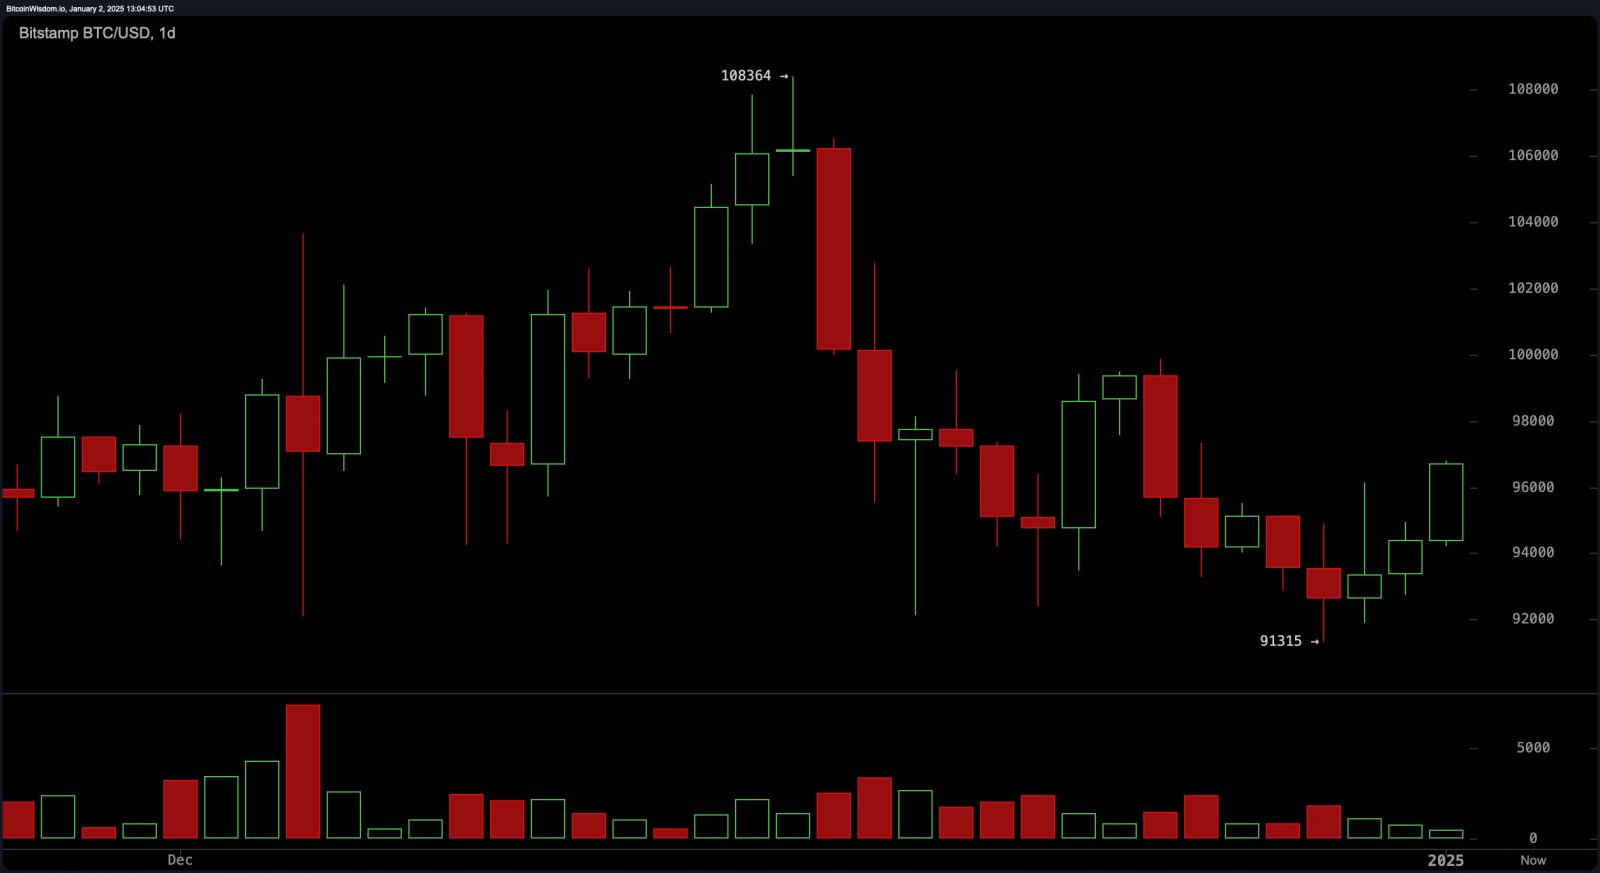
The daily chart showcases a shift from a downward trend, where bitcoin rebounded from a local bottom of $91,315 and soared past $96,000. Moving averages like the EMA and SMA across different timeframes reveal a mixed bag of emotions, with immediate buy signals clashing against resistance from longer-term averages.

BTC/USD Daily chart on Jan. 2, 2024.
Oscillators, such as the relative strength index (RSI) at 51 and the Stochastic at 34, stay neutral, pointing to market indecision. The momentum oscillator gives a buy signal at 1,955, while the MACD at −616 suggests lingering selling pressure. Together, they paint a picture of a market that’s balanced yet cautious.
Bull Verdict:
Bitcoin’s recent recovery from $91,000 to $96,794, coupled with bullish signals from short-term moving averages and upward momentum on hourly and 4-hour charts, indicates the potential for a breakout above $97,500. A successful breach of this resistance could pave the way for a test of the $100,000 psychological barrier, bolstered by strong market interest and steady volume spikes.
Bear Verdict:
Despite the recovery, neutral oscillators and selling pressure indicated by the MACD suggest caution. If bitcoin fails to break above $97,500 or retraces below $94,500, bearish momentum could take over, potentially testing support levels around $91,000 as the broader market sentiment appears mixed.


 Bitcoin
  Ethereum
  Tether
  Dogecoin
  USDC
USDC  Cardano
  TRON
TRON  Chainlink
  Stellar
  Hedera
  Bitcoin Cash
  Litecoin
  LEO Token
  Cronos
  Ethereum Classic
  Monero
  Algorand
  Dai
Dai  OKB
OKB  Cosmos Hub
  Stacks
  Theta Network
  Gate
Gate  Tezos
Tezos  Maker
Maker  KuCoin
  IOTA
IOTA  NEO
NEO  Polygon
  Zcash
Zcash  Synthetix Network
  Tether Gold
  Dash
Dash  TrueUSD
  Holo
Holo  0x Protocol
  Zilliqa
  Enjin Coin
  Basic Attention
  Qtum
Qtum  Ravencoin
  Siacoin
  Bitcoin Gold
  Decred
  DigiByte
  Hive
Hive  NEM
NEM  Ontology
  Nano
Nano  Huobi
Huobi  Status
  Waves
Waves  Lisk
Lisk  Steem
Steem  Numeraire
  Pax Dollar
  BUSD
BUSD  OMG Network
  Ren
Ren  Bitcoin Diamond