Bitcoin Technical Analysis: BTC Consolidates, Signaling Potential Breakout

Bitcoin is currently trading at $63,554, following a fluctuating 24-hour range between $62,479 and $64,687. Key technical indicators show mixed signals, with consolidation after recent resistance at $64,730. Traders are watching closely for potential entry points as market indecision sets in across multiple timeframes.
Bitcoin
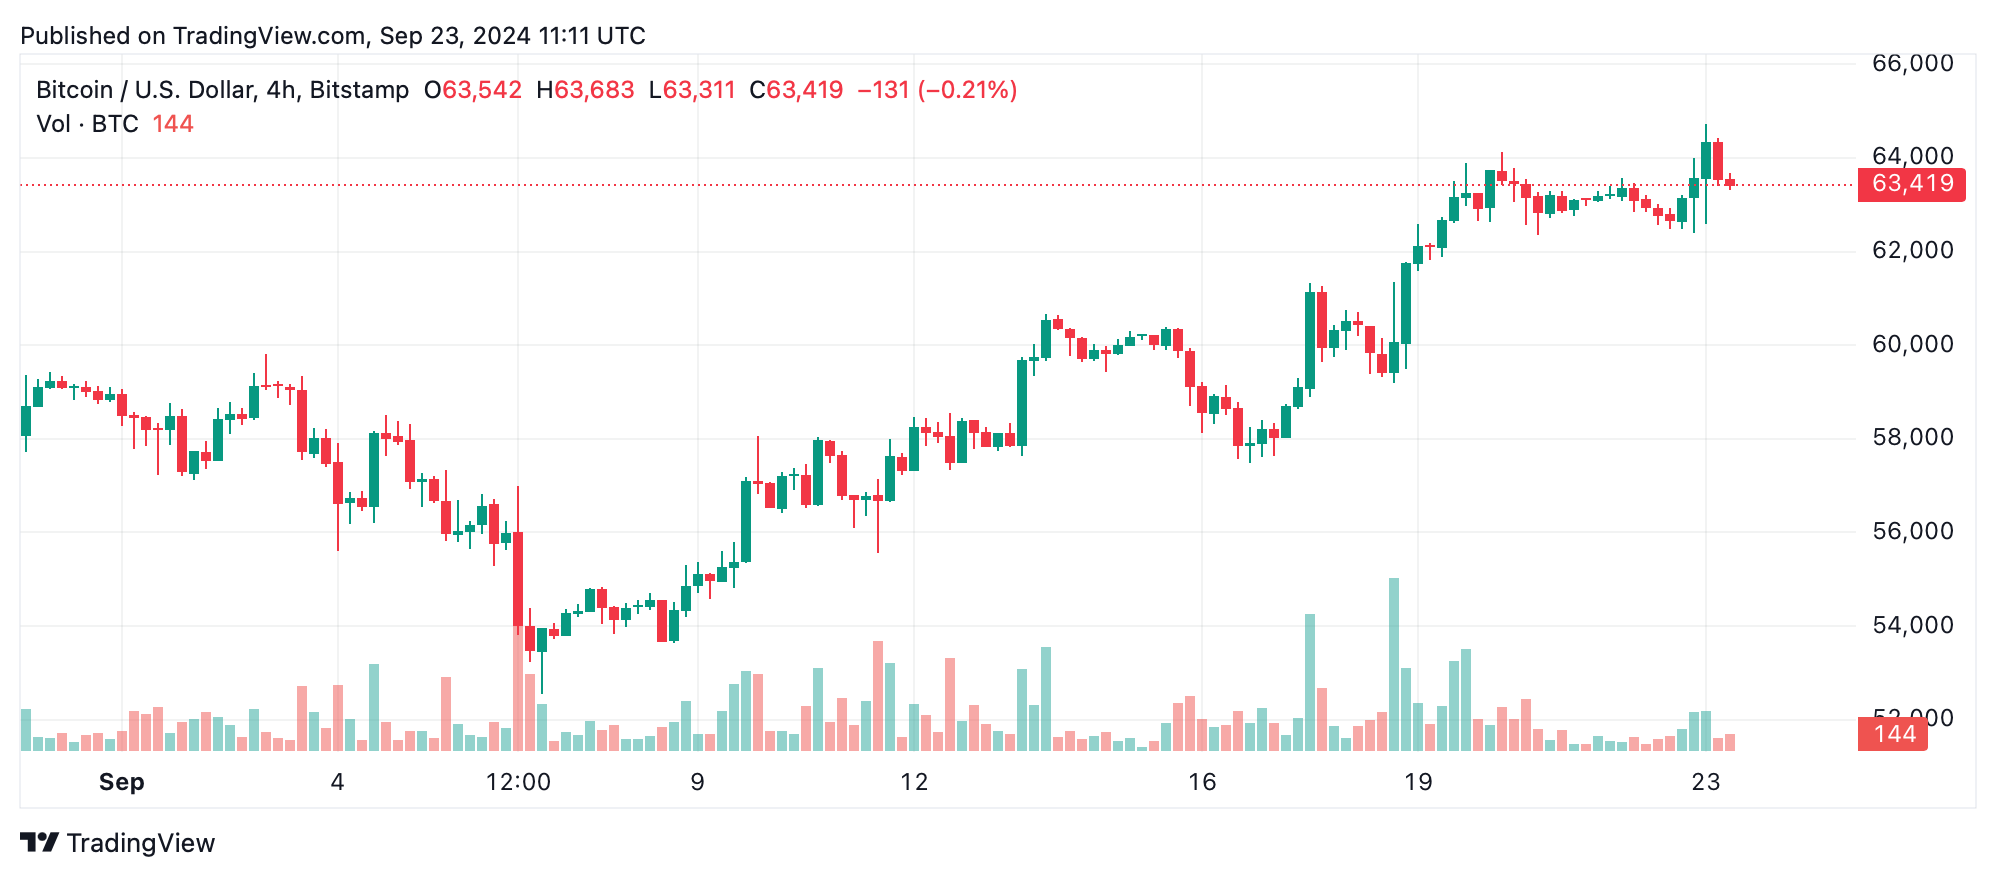
On the 1-hour chart, bitcoin (BTC) shows signs of cooling off after reaching the key resistance level of $64,730. Price action has been largely sideways since, consolidating around $63,500. The rejection from $64,730, coupled with declining volume, signals a possible weakening of bullish momentum. Traders should watch for potential support at $62,500, which could offer a short-term entry point if confirmed by volume spikes.

The 4-hour chart reflects similar behavior, with bitcoin consolidating between $63,500 and $64,000 after an initial rally from $59,000. A bearish downturn followed by indecisive price action underscores market uncertainty. With high volume driving the rally to $64,000, the recent tapering in volume may suggest a weakening buying interest.

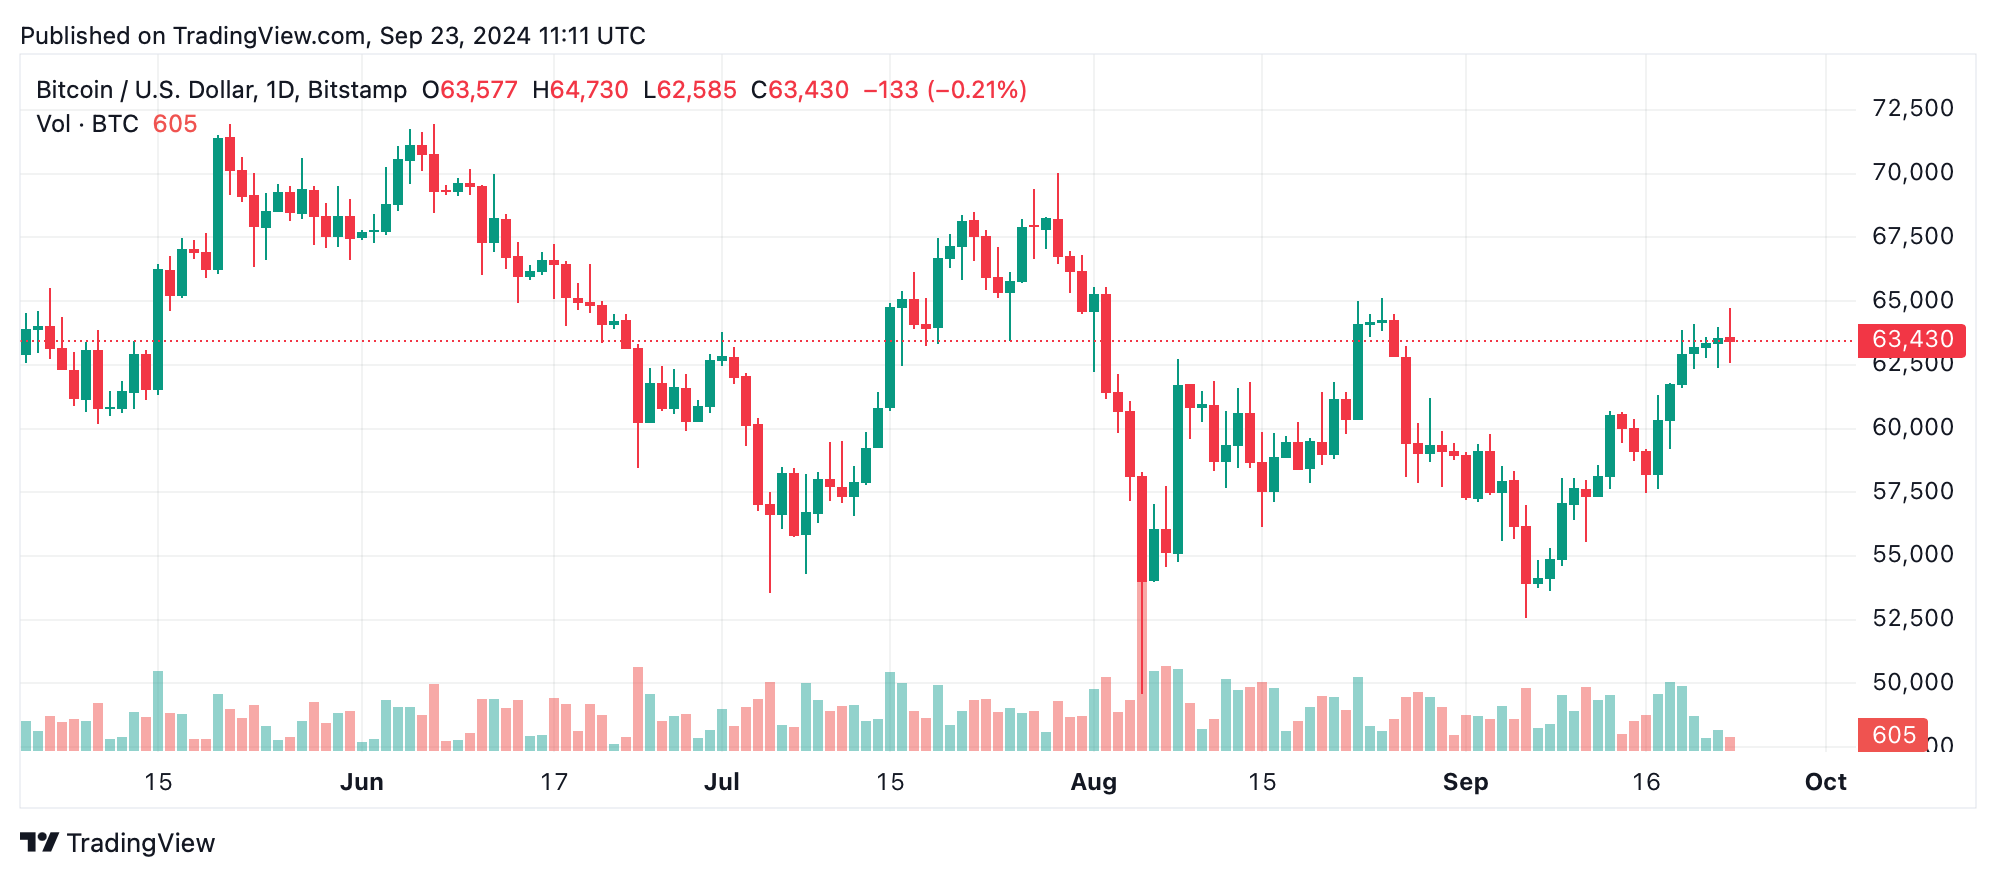
Moving to the daily chart, bitcoin’s broader uptrend remains intact, with support firmly established between $60,000 and $61,000. The price has surged from early September lows of $52,546 to test highs around $65,000. A breakout above the resistance level of $64,730 could trigger further upward momentum, targeting $65,000 and beyond. However, declining volume since mid-September hints at the potential exhaustion of buying pressure.
Oscillators present mixed signals. The relative strength index (RSI) stands at a neutral 63, suggesting neither overbought nor oversold conditions. However, the Stochastic and commodity channel index (CCI) both signal bearishness, indicating potential short-term retracements. Momentum indicators, such as the awesome oscillator and moving average convergence divergence (MACD), offer contrasting perspectives, with the latter pointing to a potentially bullish signal.
Finally, bitcoin’s moving averages (MAs) indicate strong support for the ongoing uptrend. The 10, 20, 50, and 100-period exponential and simple moving averages (EMA & SMA) all indicate optimism, reinforcing bullish sentiment. The only exception is the 200-period SMA, which reflects a sell signal at $63,922, indicating caution as bitcoin approaches key resistance levels.
Bull Verdict:
Bitcoin’s strong uptrend and support from key moving averages suggest that a breakout above $64,730 could lead to new highs, with targets of $65,000 and beyond. If the market regains momentum and buying volume increases, bitcoin could continue its bullish trajectory, reinforced by favorable moving averages and a solid foundation around $61,000.
Bear Verdict:
A failure to break the $64,730 resistance, coupled with declining volume and sell signals from oscillators, indicates the potential for a short-term pullback. If bitcoin breaks below $62,500, we may see further declines toward the $60,000–$61,000 support zone, as the market shows signs of exhaustion and indecision.


 Bitcoin
  Ethereum
  Tether
  USDC
USDC  Cardano
  Dogecoin
  TRON
TRON  Chainlink
  LEO Token
  Stellar
  Hedera
  Litecoin
  Bitcoin Cash
  Monero
  Dai
Dai  OKB
OKB  Gate
Gate  Ethereum Classic
  Cronos
  VeChain
  Cosmos Hub
  Algorand
  KuCoin
  Maker
Maker  Stacks
  Theta Network
  Tether Gold
  Tezos
Tezos  IOTA
IOTA  NEO
NEO  Zcash
Zcash  TrueUSD
  Polygon
  Synthetix Network
  Dash
Dash  Zilliqa
  Qtum
Qtum  0x Protocol
  Basic Attention
  Decred
  Holo
Holo  Siacoin
  Ravencoin
  NEM
NEM  Enjin Coin
  DigiByte
  Ontology
  Waves
Waves  Nano
Nano  Hive
Hive  Lisk
Lisk  Status
  Huobi
Huobi  Pax Dollar
  Numeraire
  Steem
Steem  BUSD
BUSD  Bitcoin Gold
  OMG Network
  Bitcoin Diamond
  Ren
Ren  Augur
Augur  HUSD
HUSD  Kyber Network Crystal Legacy