Bitcoin Technical Analysis: Bulls Eye $95,000 Breakout Amid Consolidation Battle

Bitcoin is bouncing between $93,928 and $94,154 this hour, boasting a market cap of $1.86 trillion, a daily trading volume of $29 billion, and a price swing today from $92,852 to $95,638.
Bitcoin
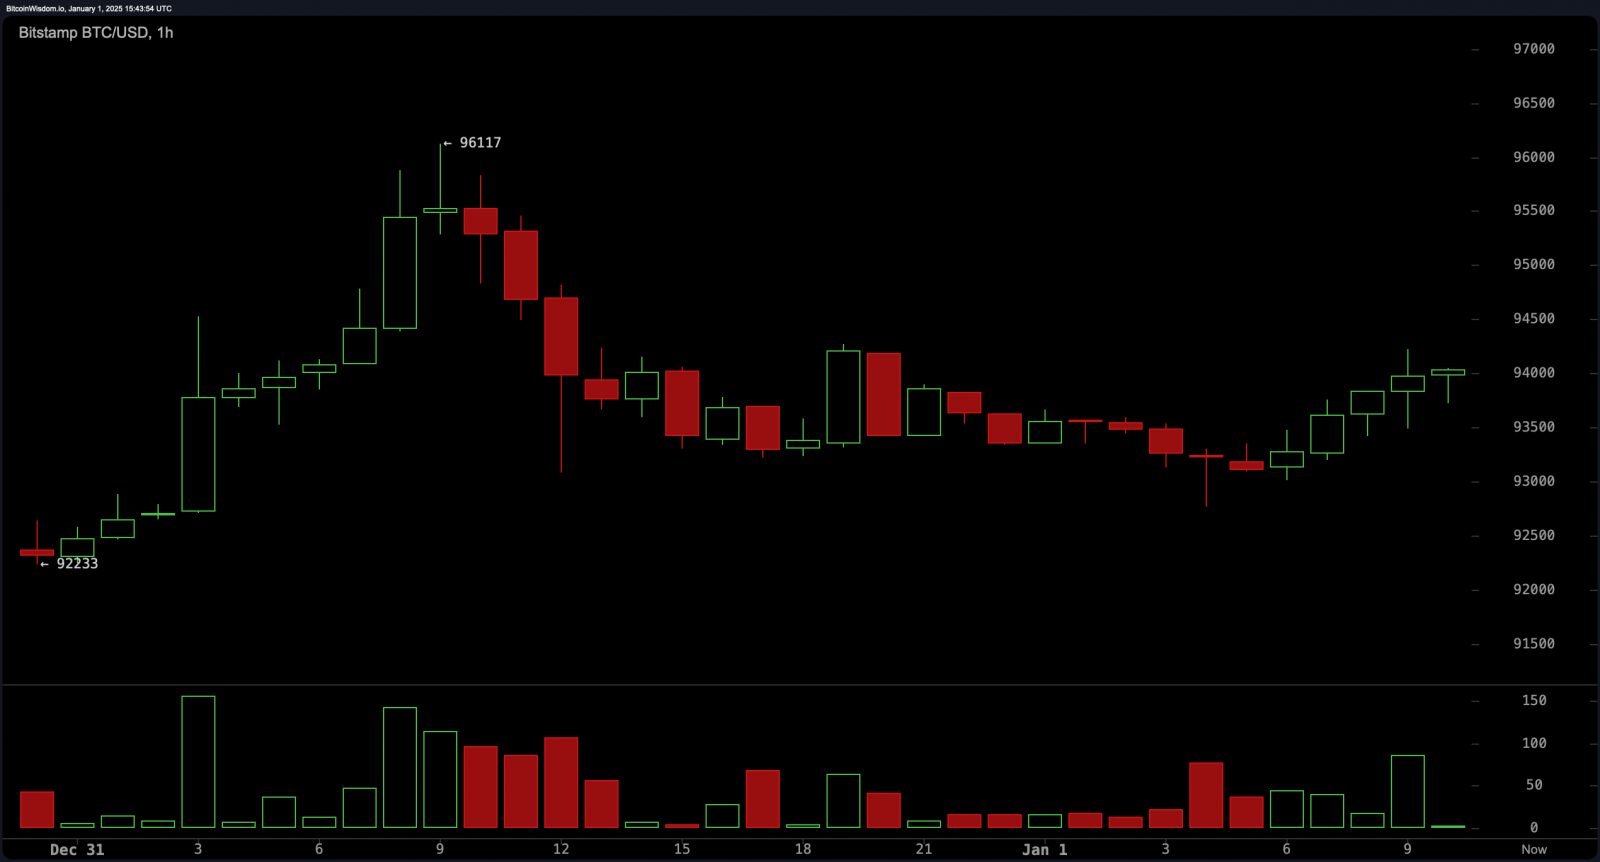
The 1-hour chart shows bitcoin in a holding pattern, trying to pick up steam after dipping to $92,233. The indicators are a mixed bag with the relative strength index (RSI) at 45, hinting at neutral vibes, while the momentum indicator at -1,122 whispers a soft maybe and indecision. Meanwhile, the moving average convergence divergence (MACD) at -808 is waving a flag for sellers, in sync with the 10 and 20-period exponential moving averages (EMA) both shouting bearishness is in the air.

BTC/USD 1H via Bitstamp on the first day of 2025.
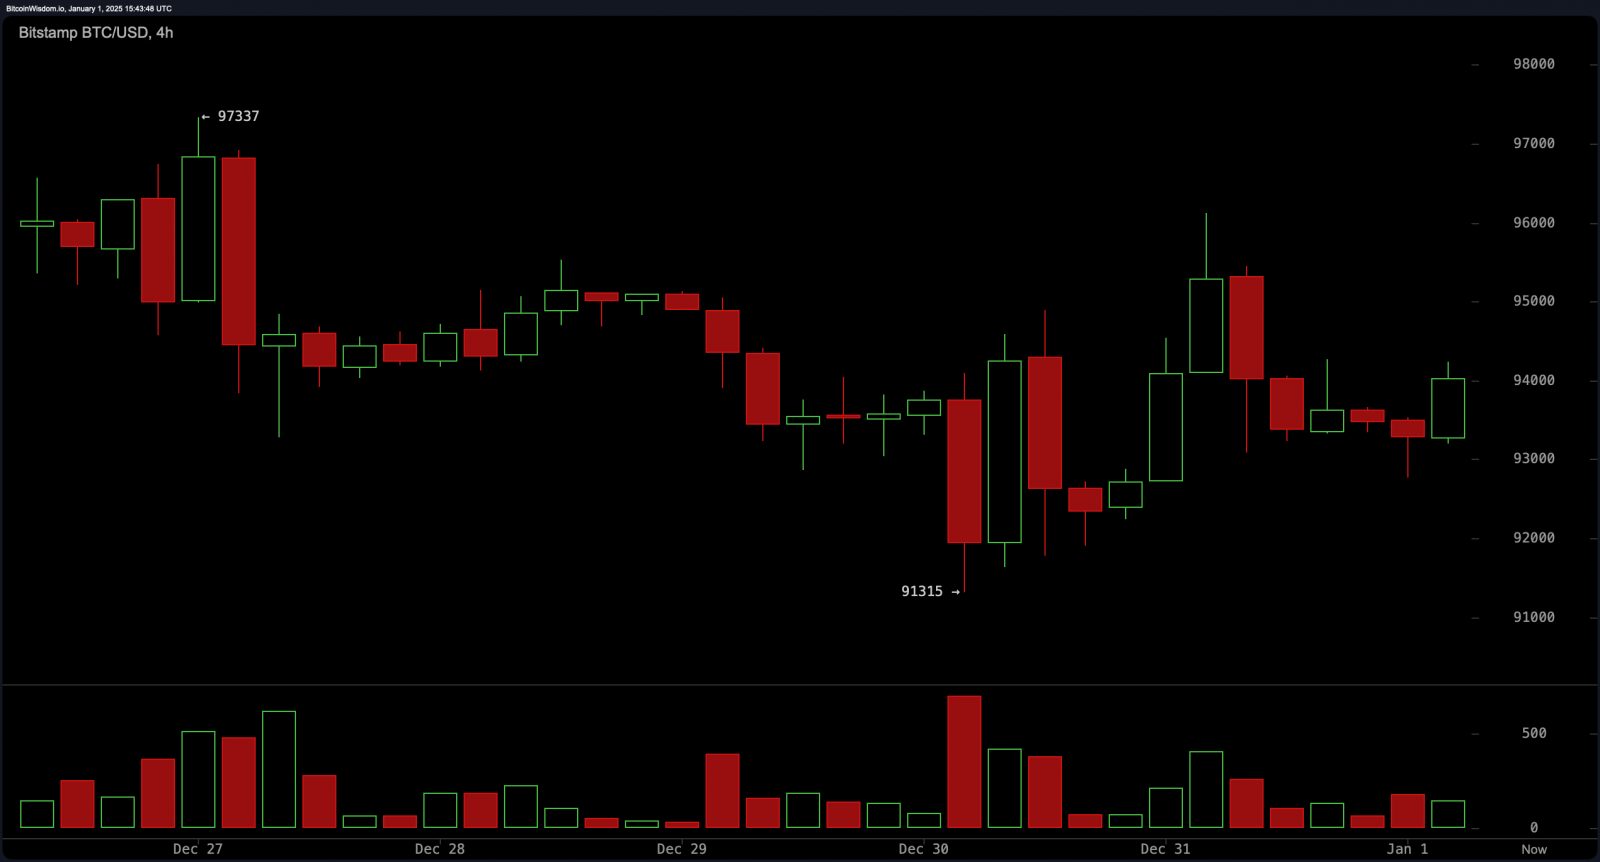
On the 4-hour chart, bitcoin hits a wall at around $95,000, where sellers are throwing a party. There’s a clear lull in action, backed by a fading average directional index (ADX) at 26, which screams no clear direction here! The Stochastic oscillator at 15 is lighting up with a positive sign, but the commodity channel index (CCI) at -85 and awesome oscillator at -4,076 are playing it cool, suggesting the market can’t make up its mind.

BTC/USD 4H via Bitstamp on Jan. 1, 2025.
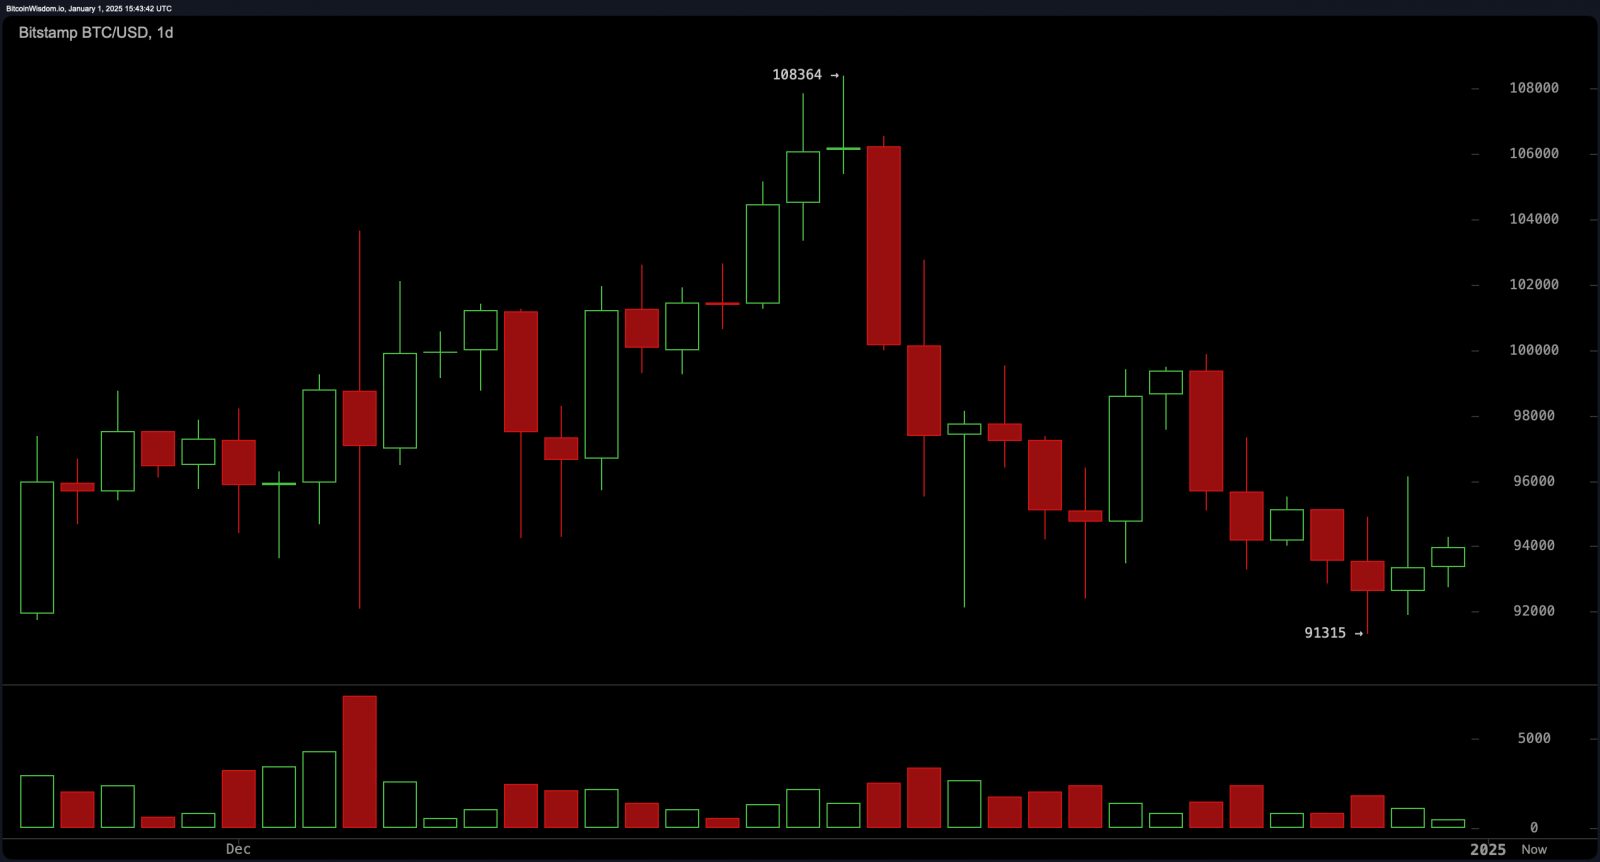
The daily chart analysis paints a picture of a broader slide for bitcoin, with solid support hanging between $91,000–$92,000 and resistance partying from $96,000–$98,000. The simple moving average (SMA) and exponential moving average for 10, 20, and 30 days are all chanting bearish signals, highlighting the downward march. The price range is getting snug, and trading volumes are dropping, signaling to play it safe as the market consolidates without any clear turn around signs.

BTC/USD Daily via Bitstamp on Jan. 1, 2025.
Longer-term moving averages, like the 100-day EMA at $85,638 and the 200-day EMA at $76,344, still lay down a bullish groundwork, despite the recent stumble. These points are golden for long-term investors eyeing entry near vital support zones. For those playing the short game, sticking to tight stop-losses and trading within the cozy range of $92,000 to $94,500 seems like the move.
Bull Verdict:
Bitcoin’s longer-term moving averages, such as the 100-day and 200-day exponential moving averages at $85,638 and $76,344, respectively, signal strong foundational support. This, combined with consolidation near critical levels, suggests potential for bullish momentum if prices break above $95,000. Long-term investors may find this a strategic opportunity to scale into positions near $92,000.
Bear Verdict:
Persistent selling pressure highlighted by short-term moving averages and a MACD favoring bearish action reflects the market’s struggle to regain upward momentum. A breakdown below $91,000 could trigger accelerated losses, with declining trade volumes and bearish short-term indicators supporting a bearish outlook in the near term. Traders should remain cautious and monitor key support levels closely.


 Bitcoin
  Ethereum
  Tether
  USDC
USDC  Dogecoin
  Cardano
  TRON
TRON  Chainlink
  Stellar
  LEO Token
  Hedera
  Litecoin
  Bitcoin Cash
  Monero
  Dai
Dai  OKB
OKB  Gate
Gate  Cronos
  Ethereum Classic
  VeChain
  Cosmos Hub
  Algorand
  KuCoin
  Maker
Maker  Stacks
  Theta Network
  Tezos
Tezos  IOTA
IOTA  Tether Gold
  Zcash
Zcash  NEO
NEO  TrueUSD
  Polygon
  Synthetix Network
  Dash
Dash  Zilliqa
  0x Protocol
  Basic Attention
  Qtum
Qtum  Holo
Holo  Decred
  Siacoin
  Ravencoin
  DigiByte
  Enjin Coin
  NEM
NEM  Nano
Nano  Ontology
  Waves
Waves  Hive
Hive  Lisk
Lisk  Status
  Pax Dollar
  Numeraire
  Huobi
Huobi  Steem
Steem  BUSD
BUSD  OMG Network
  Ren
Ren  Bitcoin Diamond
  Augur
Augur  Bitcoin Gold
  HUSD
HUSD  Kyber Network Crystal Legacy