Bitcoin’s bearish plunge signals a storm ahead for the altcoin market

The release of dovish CPI inflation data on August 14 initially provided a bullish catalyst for Bitcoin (BTC), sparking optimism among investors.
However, this positive sentiment was quickly overturned by a couple of factors, including U.S. authorities moving 10,000 BTC, valued at nearly $600 million, into a Coinbase Prime wallet, raising concerns about potential liquidation and its impact on market prices.
As Bitcoin attempts to hold above the $60,000 mark, a crypto analyst has warned that its bearish plunge could have significant implications for the broader cryptocurrency market, especially altcoins.
In an August 16 post on TradingView, analyst Alan Santana provided a detailed breakdown of Bitcoin’s current bearish trends, supported by crucial momentum indicators and price movements.
Technical analysis – Weakening momentum and bearish signals
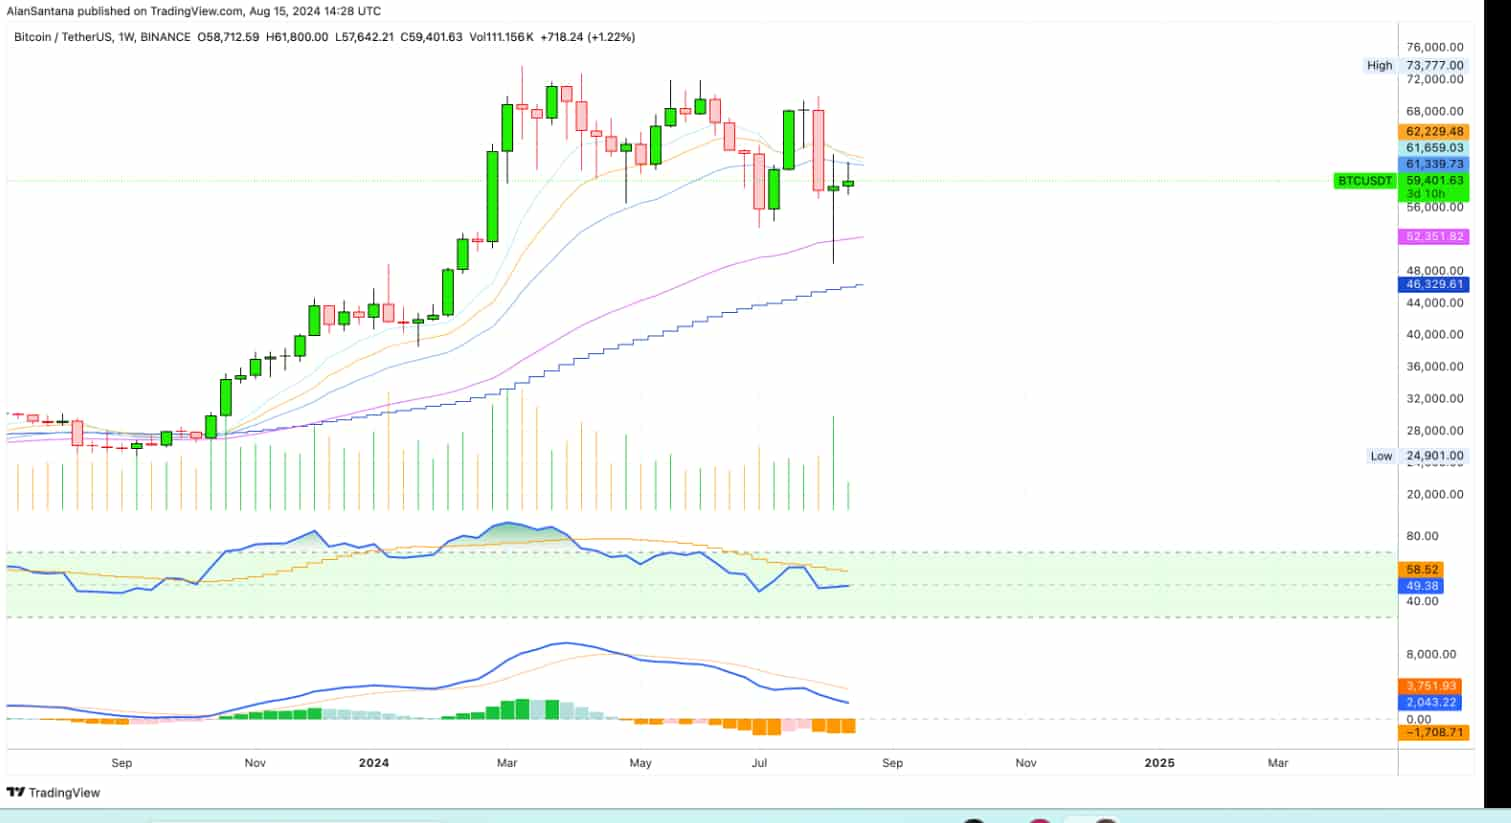
According to the analysis, the weekly technical chart reinforces the bearish narrative, with Bitcoin trading below key exponential moving averages (EMAs 8, 13, and 21).

The bearish cross among these averages suggests a mid-term downtrend, which has been building momentum over time.
The Relative Strength Index (RSI) remains weak, and the moving average convergence divergence (MACD) indicator is trending downward with a red histogram, further signaling weakening momentum.
Bitcoin’s sharp decline after briefly touching $70,000 on July 29, followed by its failure to recover convincingly, shows the lack of buying pressure in the market. This is further evidenced by its continued trading below crucial support levels, indicating that the bearish trend is deeply entrenched.
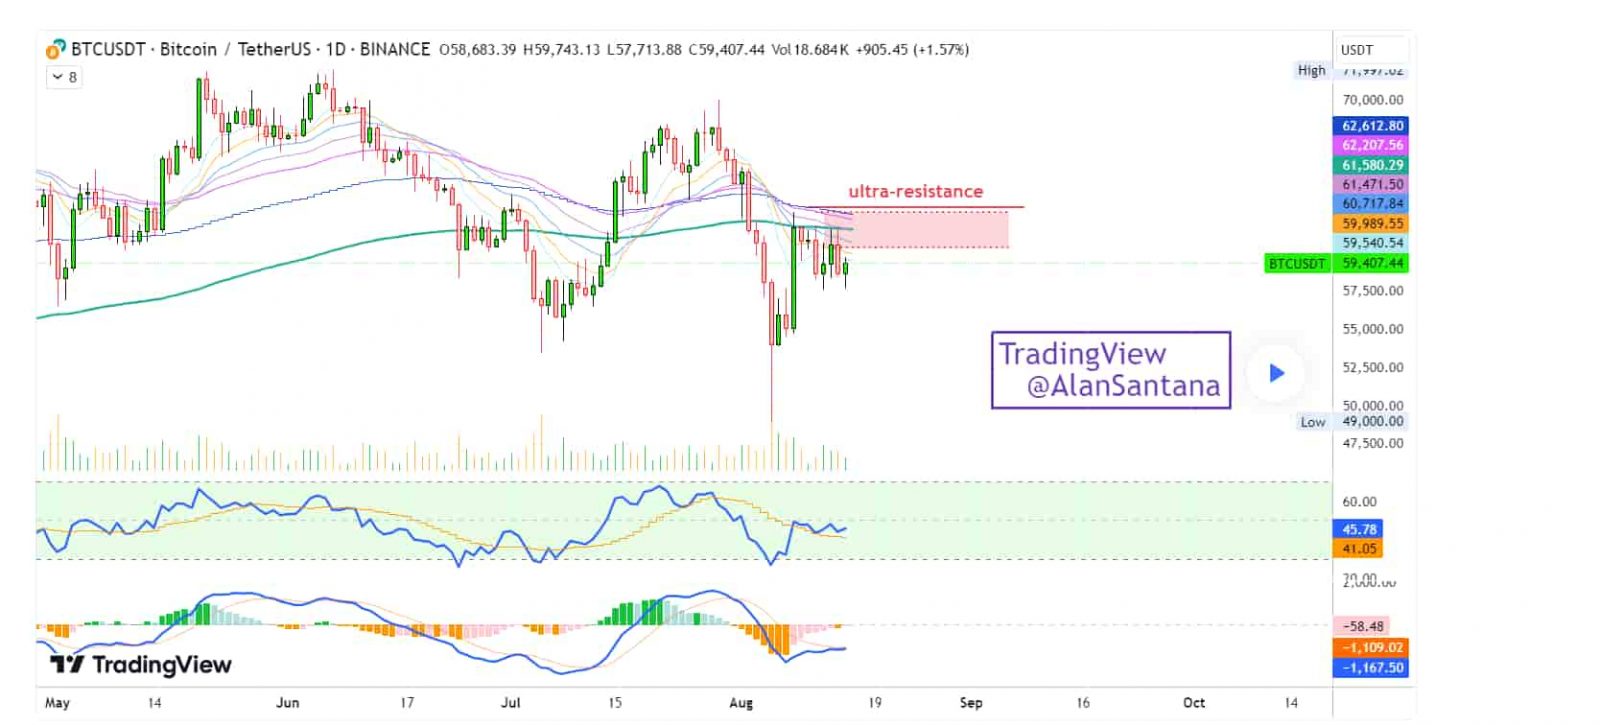
On the daily chart, Bitcoin’s inability to break through the “ultra-resistance” level around $60,000, compounded by a descending MACD and a declining RSI, suggests that further downside is likely.

The bearish cross among significant moving averages (EMAs 8/13/21/34/55/89/144) and the presence of low trading volume indicate a lack of investor confidence, pointing to the possibility of continued market declines.
Key resistance and support levels
Santana highlights that Bitcoin is currently facing a critical resistance zone between $60,000 and $61,580, with the “ultra-resistance” level identified around $60,717 on the daily chart.
This area has proven to be a formidable barrier, with Bitcoin repeatedly failing to close above it in recent weeks.
On the downside, Santana points out that Bitcoin’s immediate support lies around $57,500, a level that has provided temporary relief during recent dips.
However, the weekly chart shows that a more significant support level is around $52,351, marked by the confluence of several moving averages.
A breakdown below this level could accelerate the decline, potentially driving Bitcoin down to the $50,000 psychological support, which could trigger panic selling across the market.
Market implications for altcoins
The broader cryptocurrency market, particularly altcoins, could be significantly impacted by Bitcoin’s ongoing struggles. Historically, altcoins tend to suffer sharper declines during Bitcoin downturns due to their higher volatility.
If Bitcoin fails to hold above the $57,500 support, the altcoin market could face a more severe correction, with many altcoins potentially losing key support levels.
Bitcoin price analysis
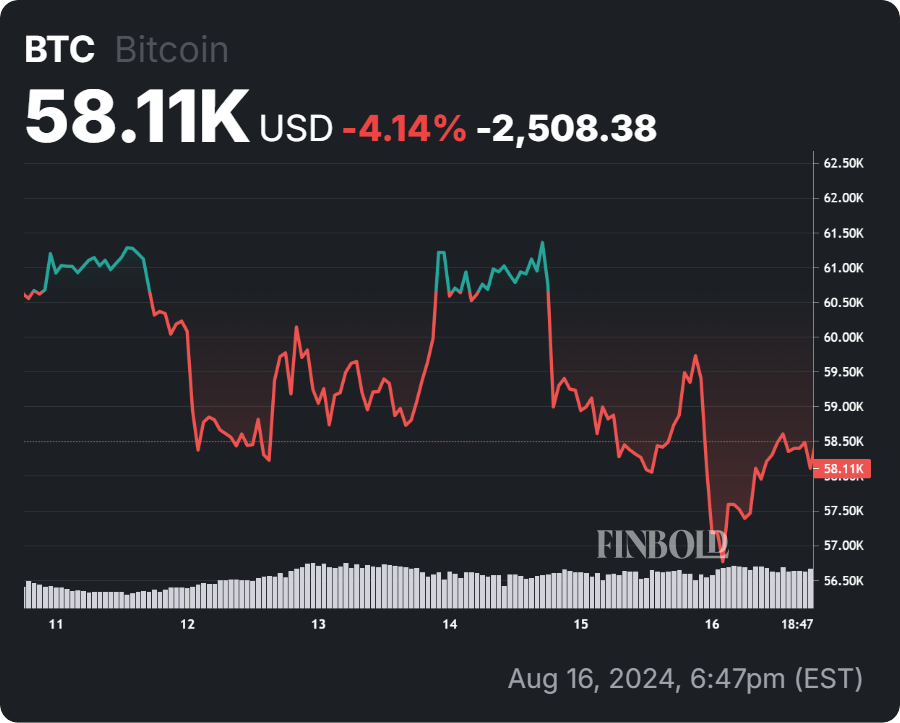
Bitcoin is currently trading at $58,501 after experiencing notable shifts in the last 24 hours. The bearish sentiment is evident on both the daily and weekly timeframes, with Bitcoin having dropped by 1.25% and 3.4%, respectively.

Investors should exercise caution, as the current technical weakness in Bitcoin suggests that the broader market could face significant downside risk.
If Bitcoin breaks below critical support levels, the altcoin market could experience a wave of panic selling, leading to even steeper declines.
Disclaimer: The content on this site should not be considered investment advice. Investing is speculative. When investing, your capital is at risk.


 Bitcoin
  Ethereum
  Tether
  USDC
USDC  Dogecoin
  Cardano
  TRON
TRON  Chainlink
  Bitcoin Cash
  LEO Token
  Litecoin
  Dai
Dai  Ethereum Classic
  Monero
  Stellar
  Cronos
  Stacks
  OKB
OKB  Hedera
  Cosmos Hub
  Maker
Maker  KuCoin
  Theta Network
  Gate
Gate  Algorand
  Polygon
  NEO
NEO  EOS
EOS  Tezos
Tezos  Tether Gold
  Zcash
Zcash  Synthetix Network
  TrueUSD
  IOTA
IOTA  Bitcoin Gold
  Holo
Holo  Dash
Dash  0x Protocol
  Zilliqa
  Siacoin
  Enjin Coin
  Ravencoin
  Qtum
Qtum  Basic Attention
  Decred
  Ontology
  NEM
NEM  Lisk
Lisk  Nano
Nano  Numeraire
  Waves
Waves  Pax Dollar
  DigiByte
  Status
  Hive
Hive  Huobi
Huobi  Steem
Steem  BUSD
BUSD  Ren
Ren  OMG Network
  Bitcoin Diamond
  Bytom
Bytom  Kyber Network Crystal Legacy
  HUSD
HUSD