Cosmos Price: Could ATOM Price Plummet Out of the Wedge?

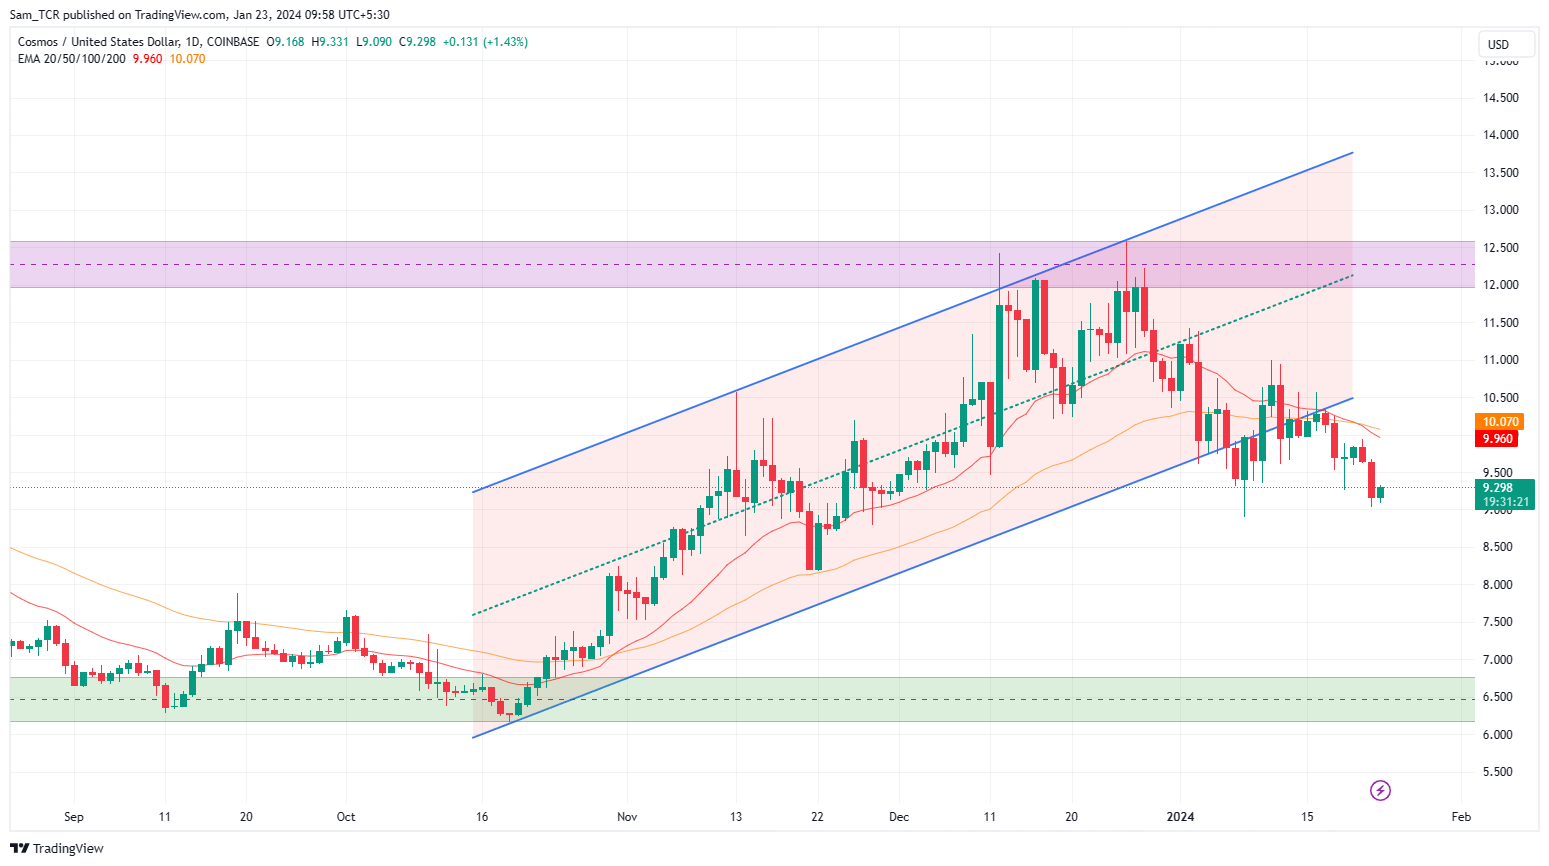
- 1 The ATOM crypto price is beneath the 20-Day and 50-Day EMAs.
- 2 The price action highlights that the crypto price has come out of the wedge and is declining.
ATOM is the native token or the functioning fuel of the Cosmos Network. People avail it for transactions, network fees, and stake to ensure the security of the network and gain rewards.
Cosmos Crypto Price Prediction Of 1-D Chart

Source: by TradingView
The ATOM price had been sliding from a weak high, sliping below on the charts, and facing constant resisting pressure.
The ATOM crypto is set for a dismal plunge, as it fails to break the resistance level and sinks to new lows from the current support zoneAlso, it has demonstrated poor performance in the past week, and one month, by 8.655 and 18.16% respectively, indicating a reliable downward trend.
At the time of publishing, the ATOM price is at $9.283 trading with an intraday increase of 1.10%, and 24-hour trading volume 138.875 million.
However, the Cosmos crypto price could continue its downtrend and hit the nearest support level at $8. If Cosmos fails to maintain the current level, it could hit the bottom and demand zone as well.
On the other hand, if ATOM breaks above the nearest resistance, it might rise to recover levels. On the upside, Cosmo’s price could encounter resistance at $10 and more.
The crypto price is beneath the 20-Day, and 50-Day EMAs (exponential moving averages) that are resisting the ATOM crypto price trend. If this continues, a steep drop is likely reliant on the selling pressure, and the ATOM price could fall more and even hit the demand zone in the flow (where the order blocks are present).
The MACD line at 0.289 and the signal line at 0.213 are beneath the zero line and have crossed each other, which highlights bearishness. The histogram gap is widening in the MACD oscillator, which suggests that the price is going down.
The RSI value is 40.40 points and the 14-Day SMA is 45.70 points, which is below the middle line. It shows that the ATOM price is closing in the oversold zone soon, further suggesting that the crypto asset is losing strength and could reach new lows.

Source: by TradingView
Summary
The price chart of Cosmos has demonstrated poor performance in the past week, and one month, by 8.655 and 18.16% respectively, indicating a reliable downward trend. However, the Cosmos crypto price could continue its downtrend and hit the nearest support level at $8. If ATOM fails to sustain at the current level, it could hit the demand zone as well.
Technical Levels
Support Levels: $8
Resistance Levels: $10
Disclaimer
In this article, the views, and opinions stated by the author, or any people named are for informational purposes only, and they don’t establish the investment, financial, or any other advice. Trading or investing in cryptocurrency assets comes with a risk of financial loss.
Steefan George
Steefan George is a crypto and blockchain enthusiast, with a remarkable grasp on market and technology. Having a graduate degree in computer science and an MBA in BFSI, he is an excellent technology writer at The Coin Republic. He is passionate about getting a billion of the human population onto Web3. His principle is to write like “explaining to a 6-year old”, so that a layman can learn the potential of, and get benefitted from this revolutionary technology.


 Bitcoin
  Ethereum
  Tether
  USDC
USDC  Dogecoin
  TRON
TRON  Cardano
  Chainlink
  Bitcoin Cash
  LEO Token
  Litecoin
  Dai
Dai  Monero
  Stellar
  Ethereum Classic
  Stacks
  OKB
OKB  Cronos
  Hedera
  Cosmos Hub
  Gate
Gate  Theta Network
  KuCoin
  Maker
Maker  Algorand
  Polygon
  Tether Gold
  NEO
NEO  EOS
EOS  Tezos
Tezos  Zcash
Zcash  TrueUSD
  Synthetix Network
  Bitcoin Gold
  IOTA
IOTA  Holo
Holo  Dash
Dash  Zilliqa
  0x Protocol
  Siacoin
  Ravencoin
  Enjin Coin
  Basic Attention
  Qtum
Qtum  Decred
  Ontology
  NEM
NEM  Lisk
Lisk  Pax Dollar
  Nano
Nano  Numeraire
  Waves
Waves  DigiByte
  Status
  Huobi
Huobi  Hive
Hive  Steem
Steem  BUSD
BUSD  Ren
Ren  OMG Network
  Bitcoin Diamond
  Bytom
Bytom  Kyber Network Crystal Legacy
  HUSD
HUSD