Daily Market Review: BTC, ETH, ENA, AIOZ, FTM

The bears are in control of today’s session, as seen from the decrease in the global market cap. The total cap stood at $3.32T as of press time, representing a 5.72% increase over the last 24 hours, while the trading volume jumped by 4.78% over the same period to stand at $274.37B as of press time
Bitcoin Price Review
Bitcoin, $BTC, has failed to post gains in today’s session, as seen from its price movements. Looking at an in-depth analysis, we see that the the Bitcoin price has recently dipped below the lower Bollinger band, indicating a potential oversold condition.
On the other hand, we see that the Awesome Oscillator shows increasing bearish momentum as indicated by growing red bars. This could suggest further downside or at least continuation of the current bearish trend. Bitcoin traded at $96,810 as of press time, representing a 4.84% decrease over the last 24 hours.
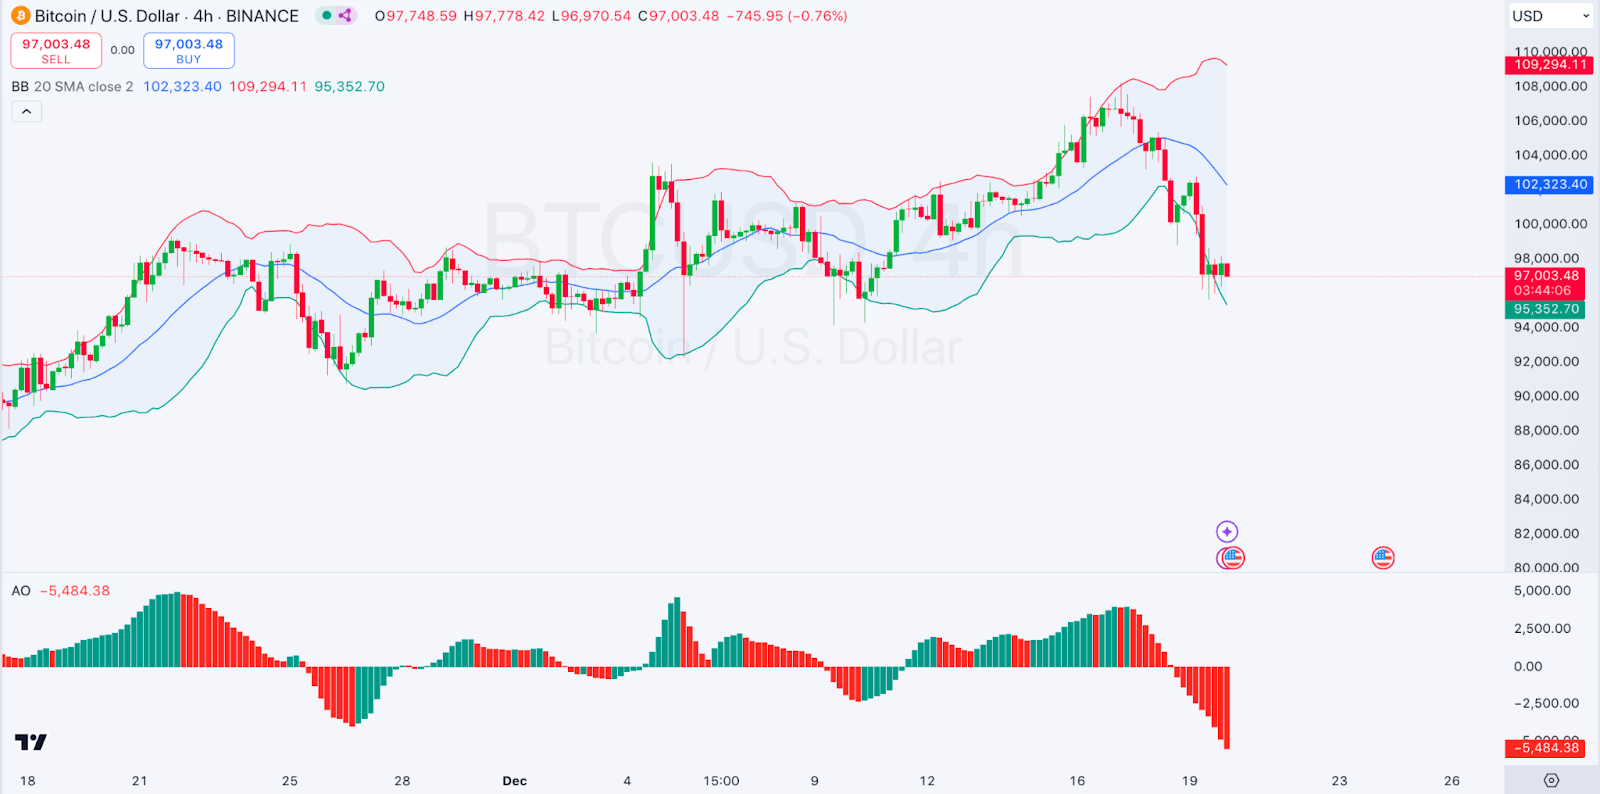
4-hour BTC|USD Chart | Source: TradingView
Ethereum Price Prediction
Ethereum, $ETH, is also not among the gainers in today’s session. Looking at an in-depth analysis, we see that Simple Moving Averages (50, 100, 200 SMA), Money Flow Index (MFI) The price recently broke below the 200 SMA, a bearish signal indicating strong selling pressure.
On the other hand, we see that the MFI very low (around 13.67), indicating oversold conditions which sometimes precede a potential reversal or bounce back in price. Ethereum traded at $3,324 as of press time, representing a 9.5% decrease over the last 24 hours.
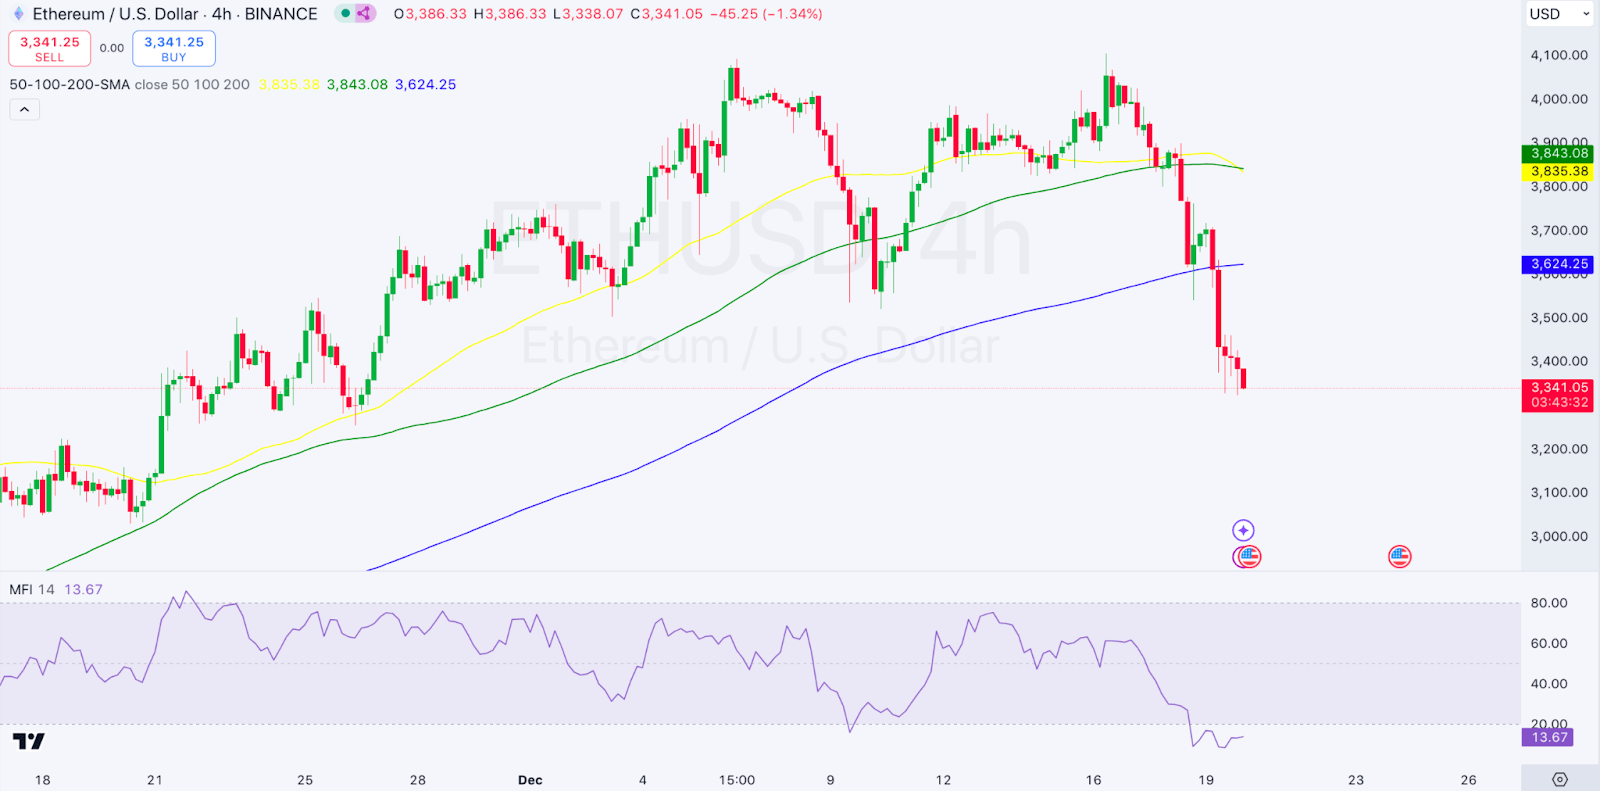
4-hour ETH/USD Chart | Source: TradingView
Ethena Price Review
Ethena, $ENA, is not among today’s session as also seen from its price movements. Looking at an in-depth analysis, we see that the Ethena price is below the Ichimoku Cloud, signifying a bearish trend.
On the other hand, we see that the ADX is high (around 20.33), suggesting that the current trend is strong, with bearish sentiment prevailing. Ethena traded at $0.8685 as of press time, representing a 25.39% decrease over the last 24 hours.
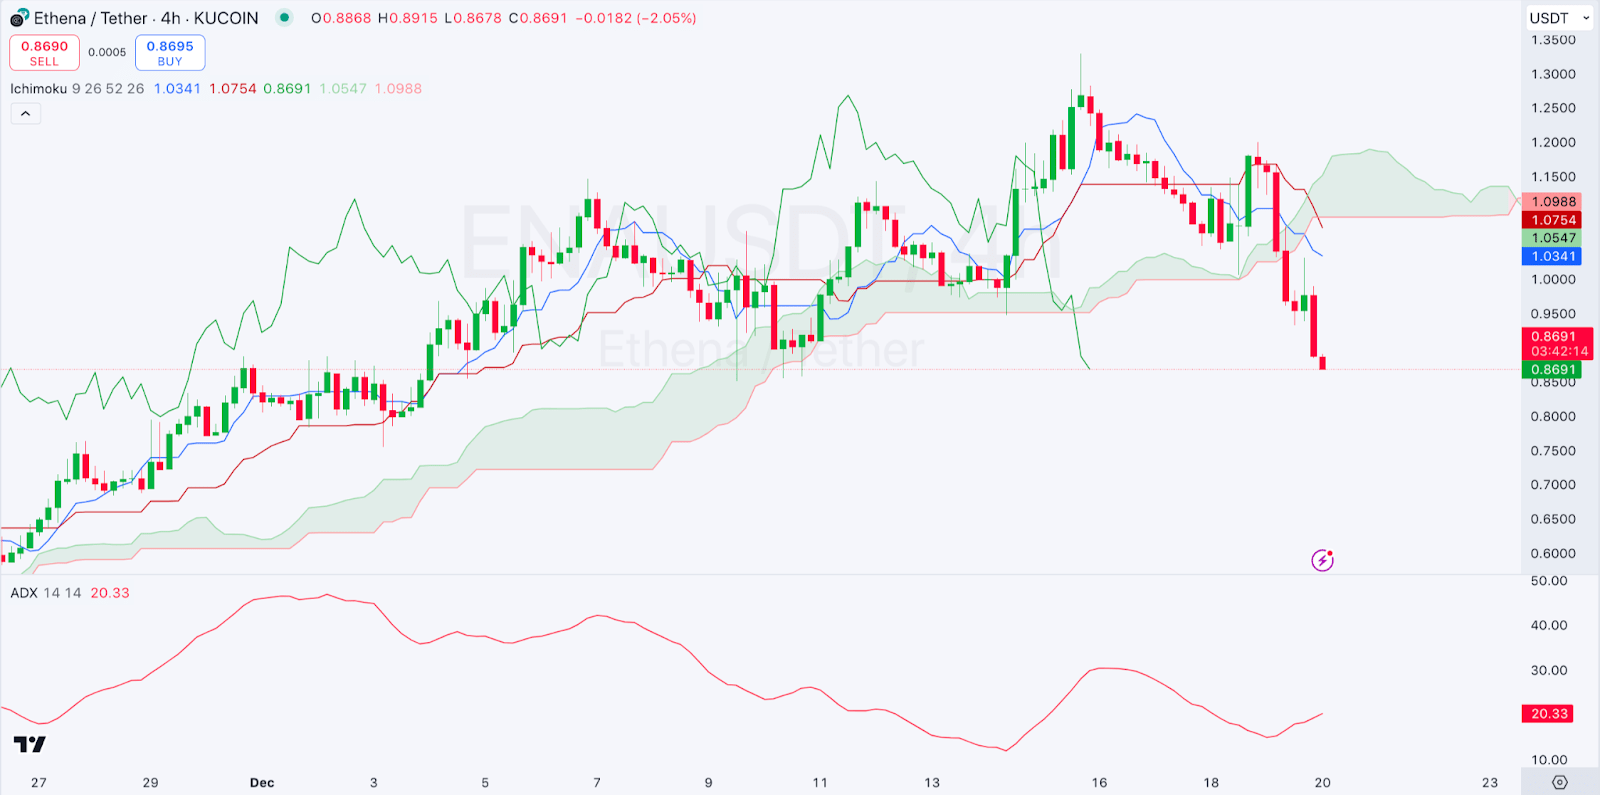
4-hour ENA/USD Chart | Source: TradingView
AIOZ Network Price Review
AIOZ Network, $AIOZ, is also not among today’s session as also seen from its price movements. Looking at an in-depth analysis, AIOZ is in a consolidation phase, with price weaving through the Alligator indicator’s lines, suggesting a lack of clear trend.
On the other hand, we see that the ADX, indicating weakening trend strength which might suggest a period of range-bound movement or consolidation. AIOZ Network traded at $0.8685 as of press time, representing a 16.78% decrease over the last 24 hours.
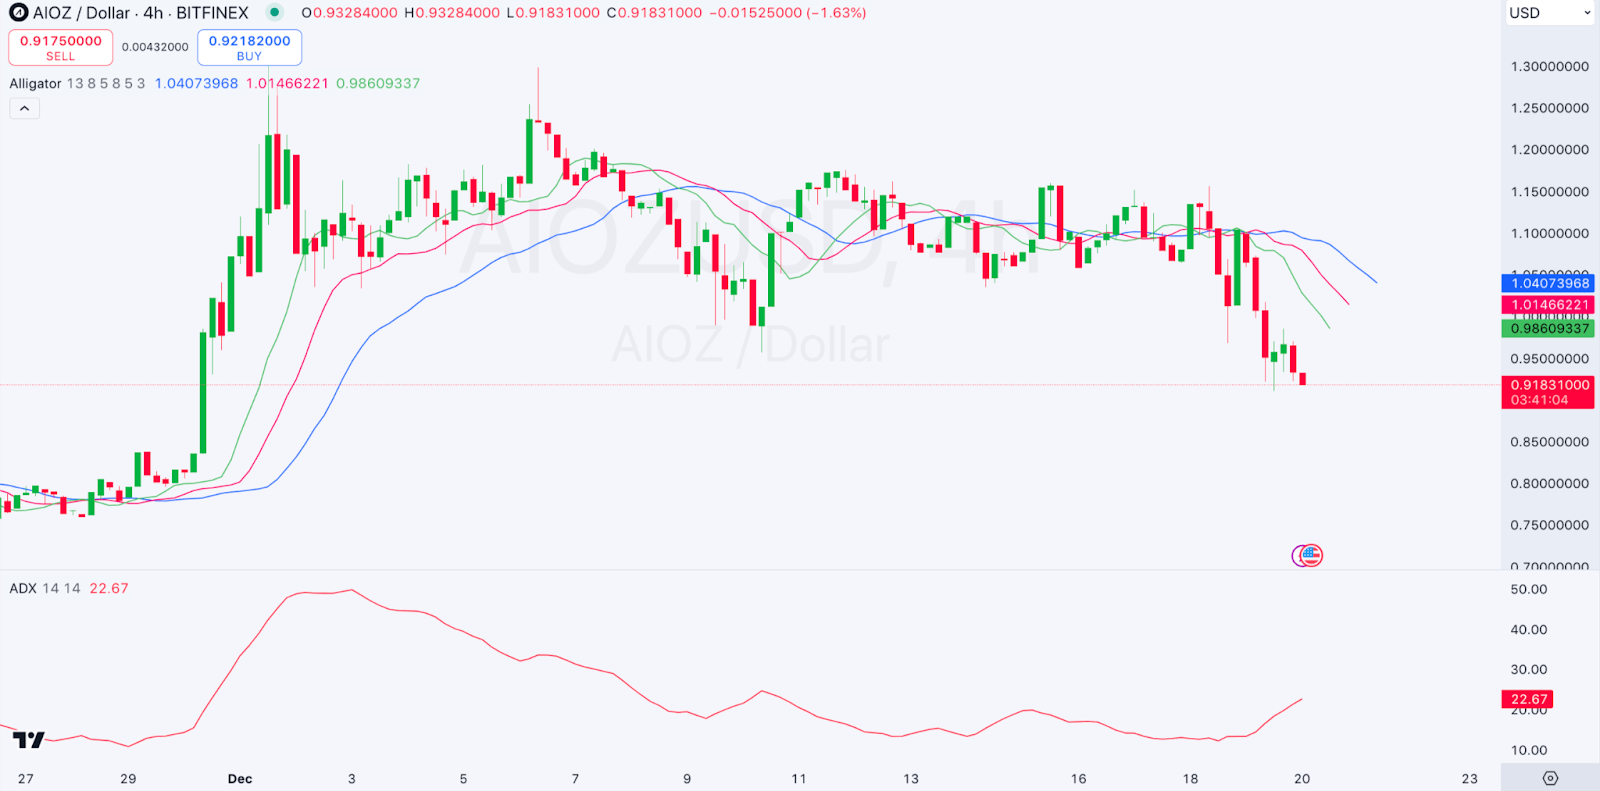
4-hour AIOZ/USD Chart | Source: TradingView
Fantom Price Review
Fantom, $FTM, is also among the top losers in today’s session as also seen from its price movements. Looking at an in-depth analysis, we see that the recent sharp price decline with the SuperTrend indicator signaling a sell.
On the other hand, we see the Volume Oscillator shows a decrease in volume, potentially indicating less conviction in the recent downward movements which could hint at a possible stabilization or reversal. Fantom traded at $0.9168 as of press time, representing a 19.66% decrease over the last 24 hours.
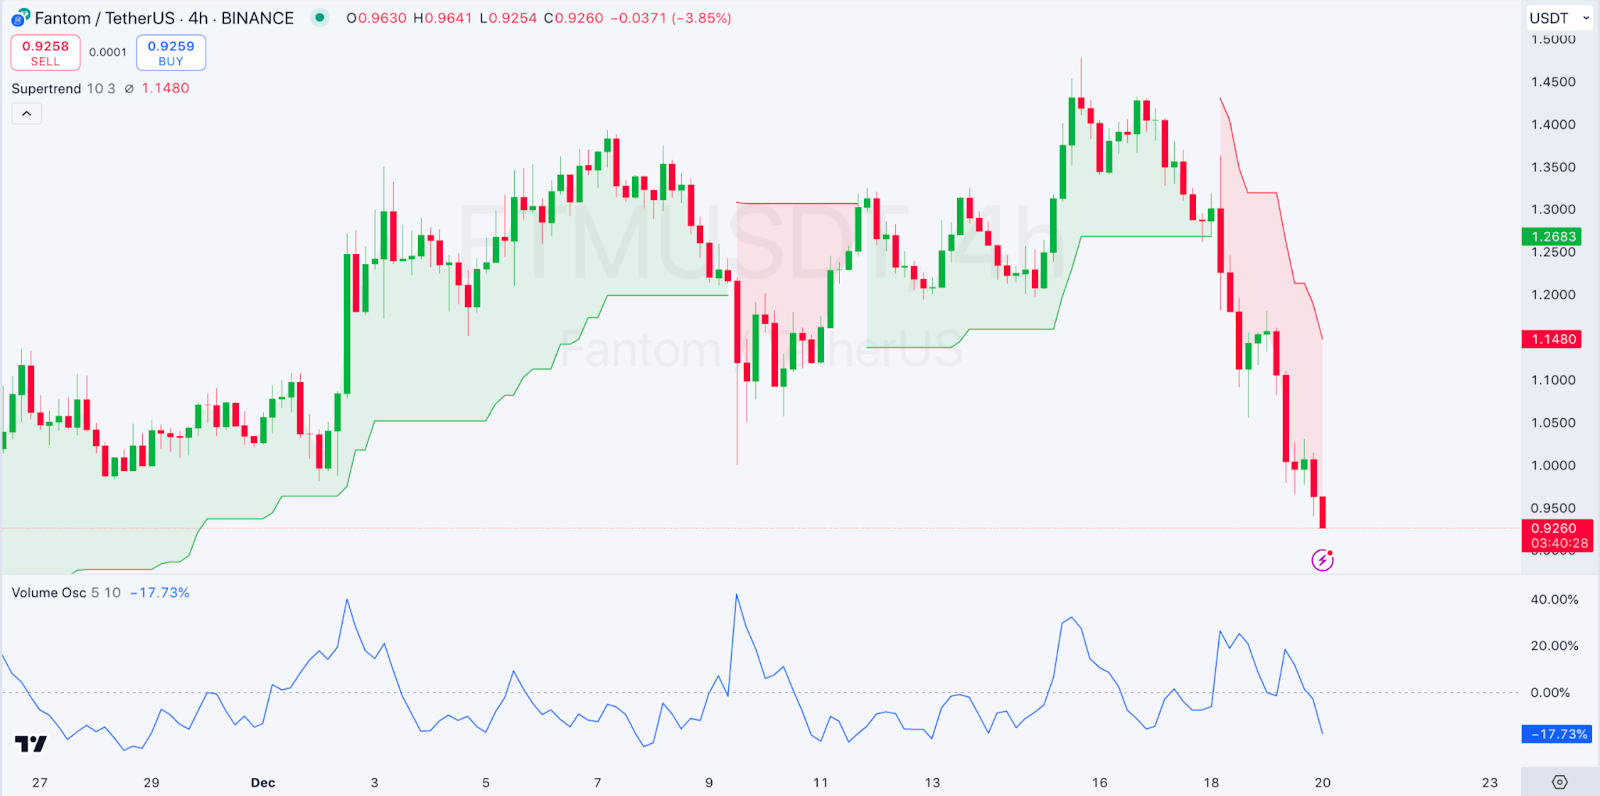
4-hour FTM/USD Chart | Source: TradingView


 Bitcoin
  Ethereum
  Tether
  Dogecoin
  USDC
USDC  Cardano
  TRON
TRON  Chainlink
  Stellar
  Hedera
  Bitcoin Cash
  LEO Token
  Litecoin
  Cronos
  Ethereum Classic
  Monero
  Dai
Dai  Algorand
  OKB
OKB  Cosmos Hub
  Stacks
  Theta Network
  Gate
Gate  Maker
Maker  KuCoin
  Tezos
Tezos  IOTA
IOTA  NEO
NEO  Zcash
Zcash  Polygon
  Synthetix Network
  Tether Gold
  TrueUSD
  Dash
Dash  Holo
Holo  Zilliqa
  Enjin Coin
  0x Protocol
  Siacoin
  Basic Attention
  Qtum
Qtum  Ravencoin
  Bitcoin Gold
  Decred
  NEM
NEM  DigiByte
  Ontology
  Nano
Nano  Status
  Hive
Hive  Waves
Waves  Huobi
Huobi  Lisk
Lisk  Steem
Steem  Numeraire
  Pax Dollar
  BUSD
BUSD  OMG Network
  Ren
Ren  Bitcoin Diamond
  Bytom
Bytom