Daily Market Review: BTC, ETH, TON, ZETA, XRP

Bulls are dormant in today’s session as seen from the rise in the global market cap. The total cap stood at $2.2T as of press time, representing a 1.8% increase over the last 24 hours while the trading volume dropped by 18% within the same period to stand at $70.18.
Bitcoin Price Review
Bitcoin (BTC) has now moved back above $60K amid its recovery run today. In-depth analysis shows that the Bitcoin chart shows recent upward momentum breaking through the moving average and the Bollinger Bands converging slightly, which can indicate increased volatility. The Bitcoin price has crossed above the 20-day Simple Moving Average (SMA), signalling potential bullish behaviour.
On the other hand, the Moving Average Convergence Divergence (MACD) shows a bullish crossover, with the MACD line crossing above the signal line. This is typically a buy signal. As of press time, the Bitcoin price stood at $61,917, representing a 4.8% jump from its previous 24-hour price.
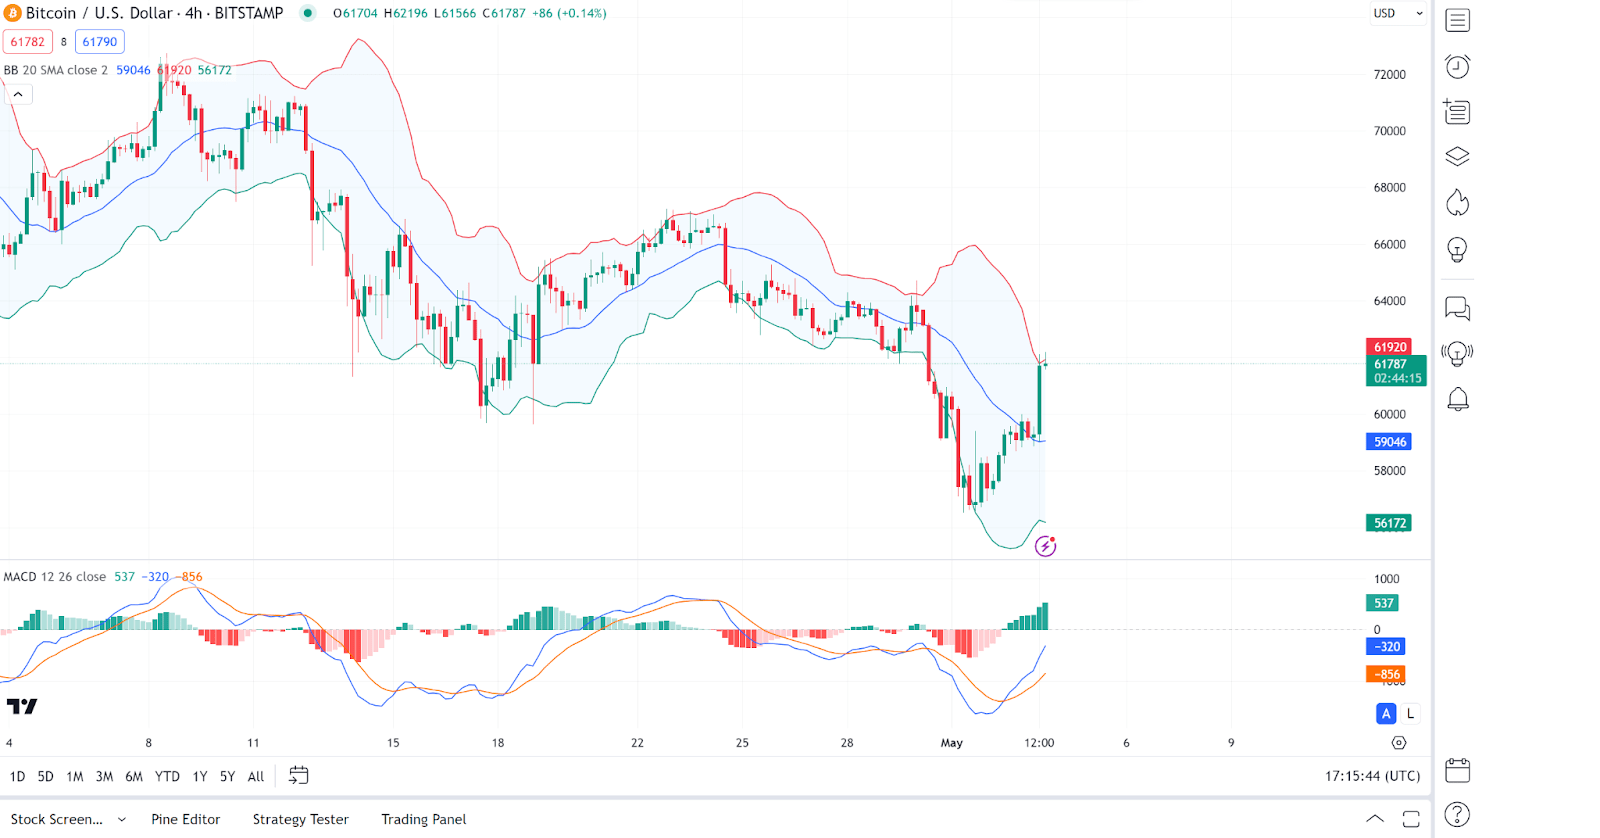
4-hour BTC/USD Chart | Source: TradingView
Ethereum Price Review
Ethereum (ETH) is also another gainer in today’s session as evidenced by its price movements. However, looking at an in-depth analysis, we see that Ethereum’s price appears to be oscillating within a tight range, struggling to break above a significant resistance level marked by the Supertrend indicator.
On the other hand, the Awesome Oscillator (AO) is showing green bars, indicating some bullish momentum, though the overall trend remains neutral given the lack of sustained movement beyond the resistance level. As of press time, the Ethereum price stood at $3,077, representing a 2.7% jump from its previous 24-hour price.
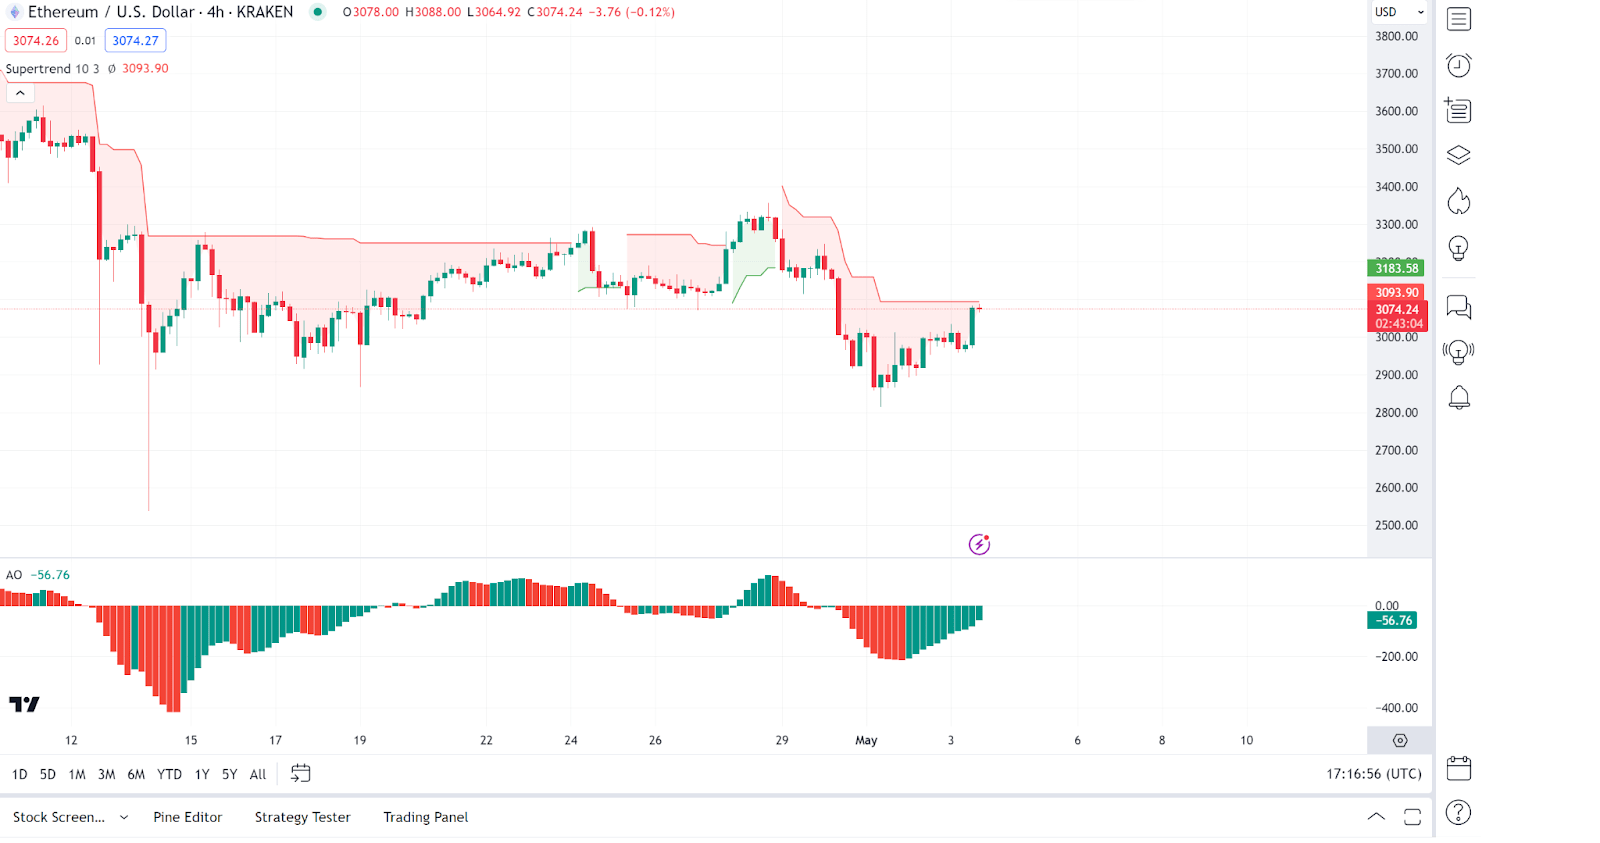
4-hour ETH/USD Chart | Source: TradingView
Toncoin Price Review
Toncoin (TON) is also another gainer in today’s session as evidenced by today’s price action. Looking at an in-depth analysis, we see that Toncoin has shown a recent upswing, with the price crossing above both the moving average lines, suggesting a short-term bullish trend.
Looking at other indicators, we see that the Money Flow Index (MFI) is quite high at around 79, indicating that the asset might be getting into the overbought territory, which can sometimes precede a pullback. As of press time, the Toncoin price stood at $5.56, representing an 8.3% jump from its previous 24-hour price.
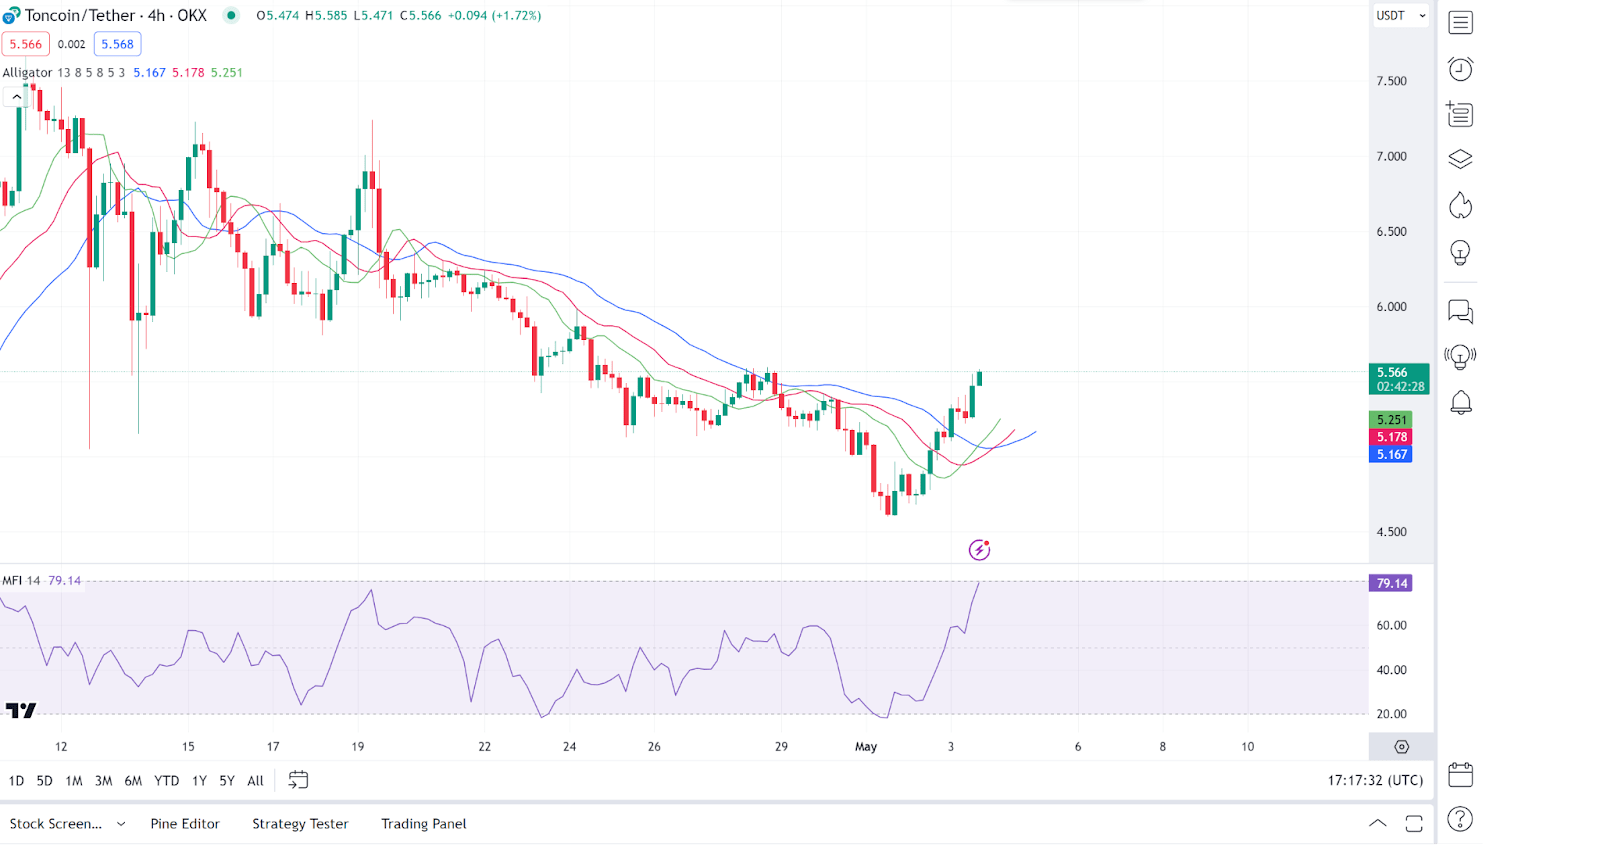
4-hour TON/USDT Chart | Source: TradingView
ZetaChain Price Review
ZetaChain (ZETA) is also another top gainer in today’s session, as evidenced by its price movements. In-depth analysis shows that ZetaChain price charts show a rising channel pattern, suggesting a bullish trend as long as the price remains within the channel boundaries.
On the other hand, the Commodity Channel Index (CCI) is within the normal range, supporting the continuation of the current trend without indicating overbought or oversold conditions. As of press time, the ZetaChain price stood at $1.58, representing a 20.7% jump from its previous 24-hour price.
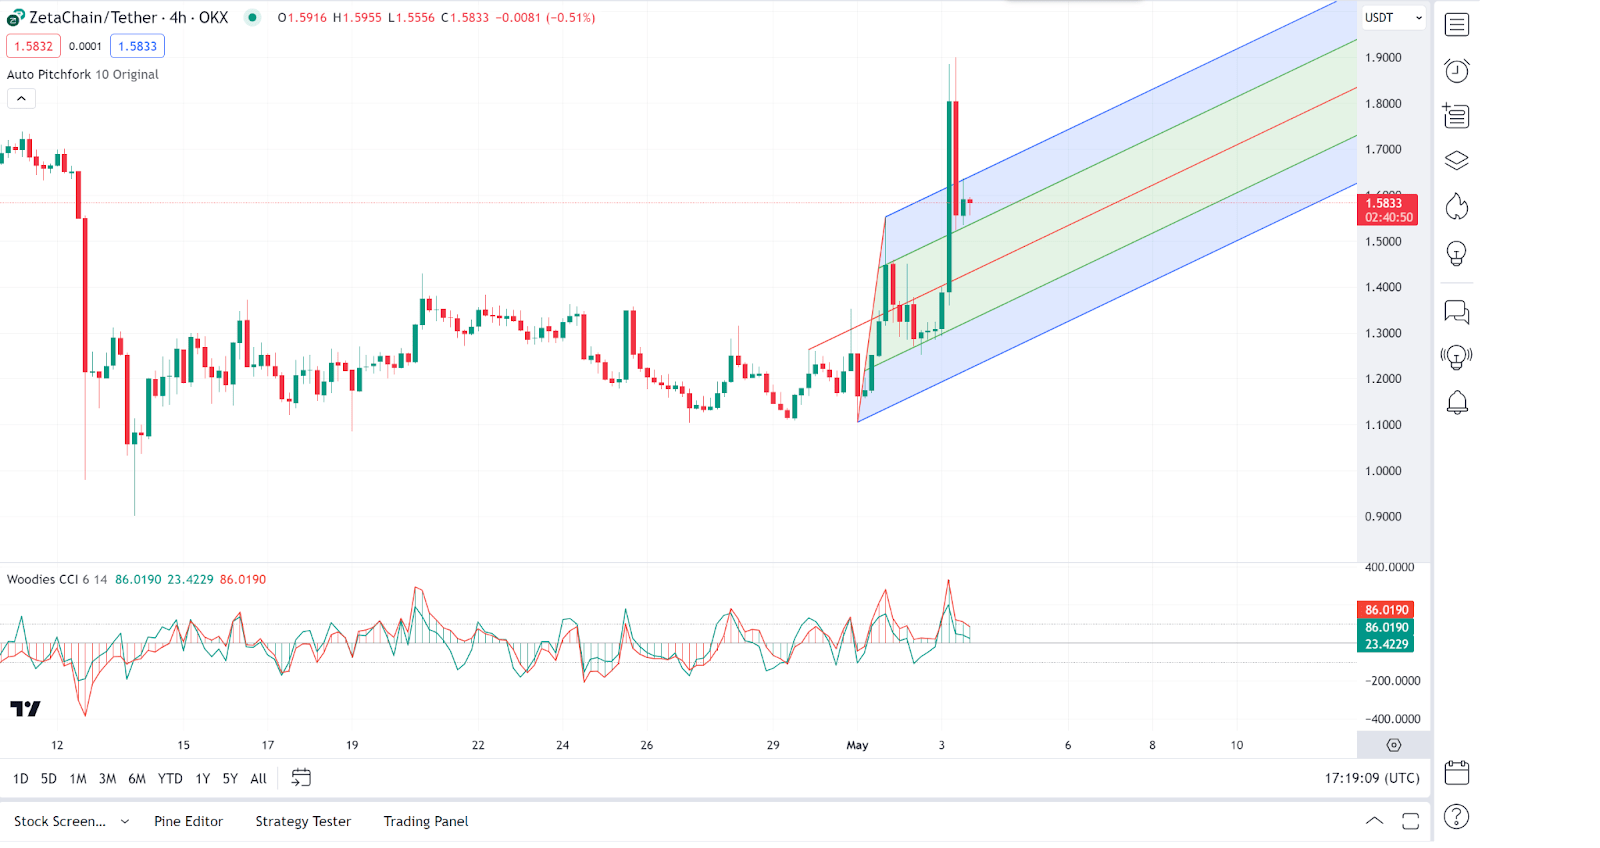
4-hour ZETA/USDT Chart | Source: TradingView
Ripple Price Review
Ripple (XRP) has also not been left behind as it also managed some slight gains in today’s session. Looking at an in-depth analysis, we see that Ripple is trading within the Ichimoku Cloud, suggesting a lack of clear trends with the price hovering around the baseline (Kijun-Sen).
On the other hand, the Average Directional Index (ADX) is below 20, indicating a weak trend and confirming the market’s indecision as seen with the Ichimoku Cloud. As of press time, the Ripple price stood at $0.5278, representing a 1.69% jump from its previous 24-hour price.
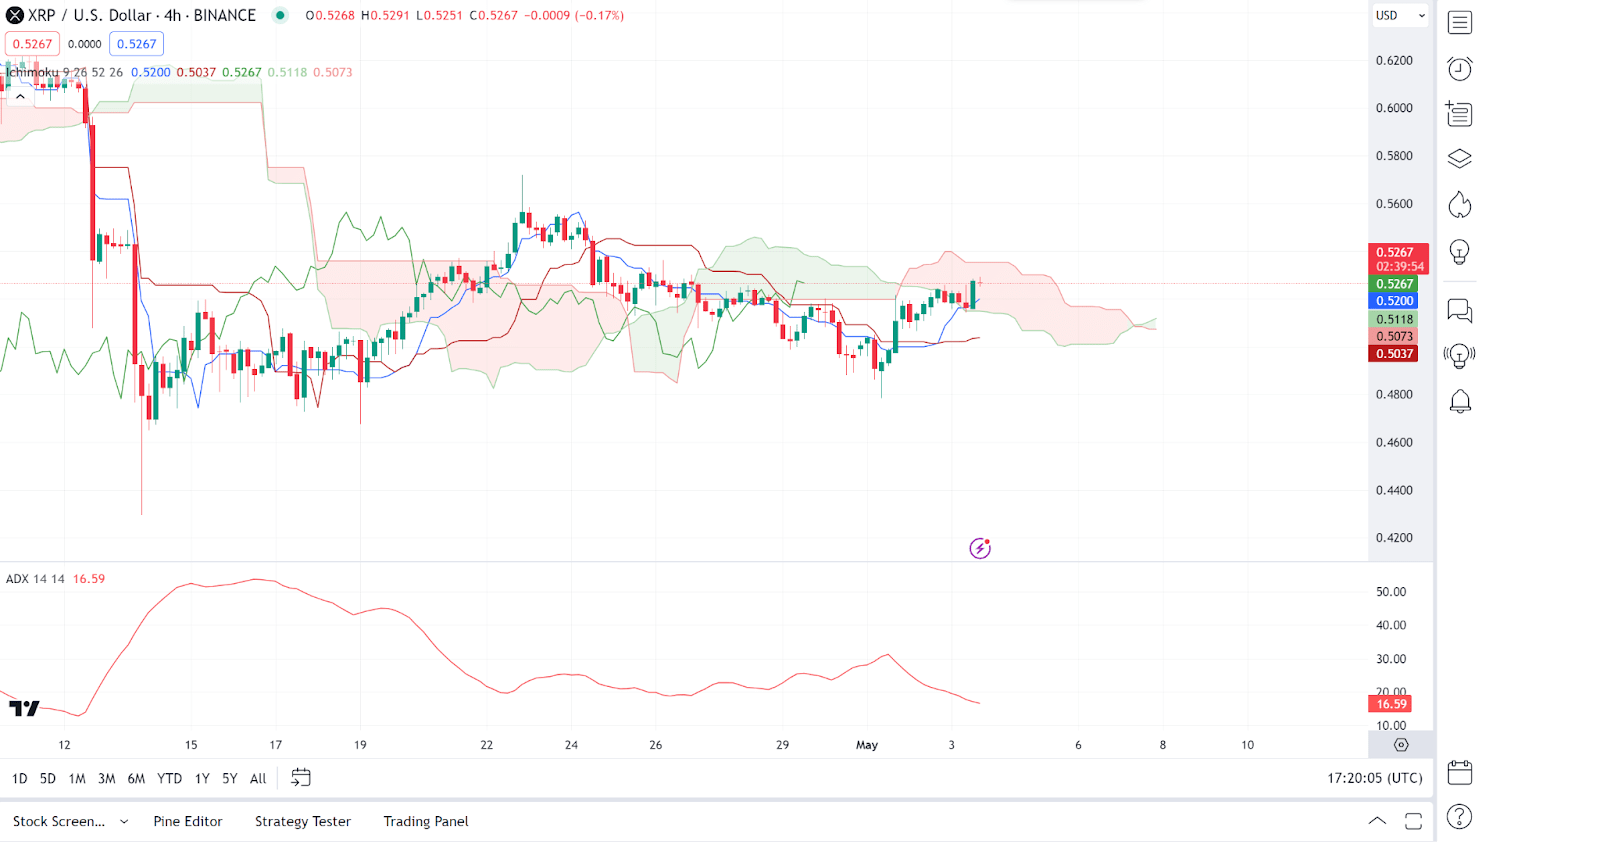
4-hour XRP/USD Chart | Source: TradingView


 Bitcoin
  Ethereum
  Tether
  Dogecoin
  USDC
USDC  Cardano
  TRON
TRON  Chainlink
  Stellar
  Hedera
  Bitcoin Cash
  LEO Token
  Litecoin
  Cronos
  Ethereum Classic
  Monero
  Dai
Dai  Algorand
  OKB
OKB  Cosmos Hub
  Stacks
  Theta Network
  Gate
Gate  Maker
Maker  KuCoin
  Tezos
Tezos  IOTA
IOTA  NEO
NEO  Polygon
  Zcash
Zcash  Synthetix Network
  Tether Gold
  TrueUSD
  Dash
Dash  Holo
Holo  Zilliqa
  Enjin Coin
  0x Protocol
  Qtum
Qtum  Basic Attention
  Siacoin
  Ravencoin
  Bitcoin Gold
  Decred
  NEM
NEM  Ontology
  DigiByte
  Nano
Nano  Hive
Hive  Status
  Huobi
Huobi  Lisk
Lisk  Waves
Waves  Numeraire
  Steem
Steem  Pax Dollar
  BUSD
BUSD  OMG Network
  Ren
Ren  Bitcoin Diamond
  Bytom
Bytom