Ethereum Technical Analysis: ETH Struggles Below Resistance

Ethereum is currently priced at $2,300 as of Sept. 16, 2024, fluctuating between $2,261 and $2,416 over the past day. With a market cap of $277 billion and a trading volume hitting $15.46 billion in the last 24 hours, ether is giving traders a mix of signals. Technical charts present a predominantly bearish outlook, but there are hints of potential short-term gains.
Ethereum
On the 1-hour chart, ethereum recently dropped from $2,428 to $2,251, then settled into a sideways pattern around $2,300. Notably, the trading volume spiked at the $2,251 level, hinting at the possibility of a short-term bottom. If the price pushes above $2,300 on strong volume, a quick-buy opportunity could arise.

ETH/USD 4-hour chart.
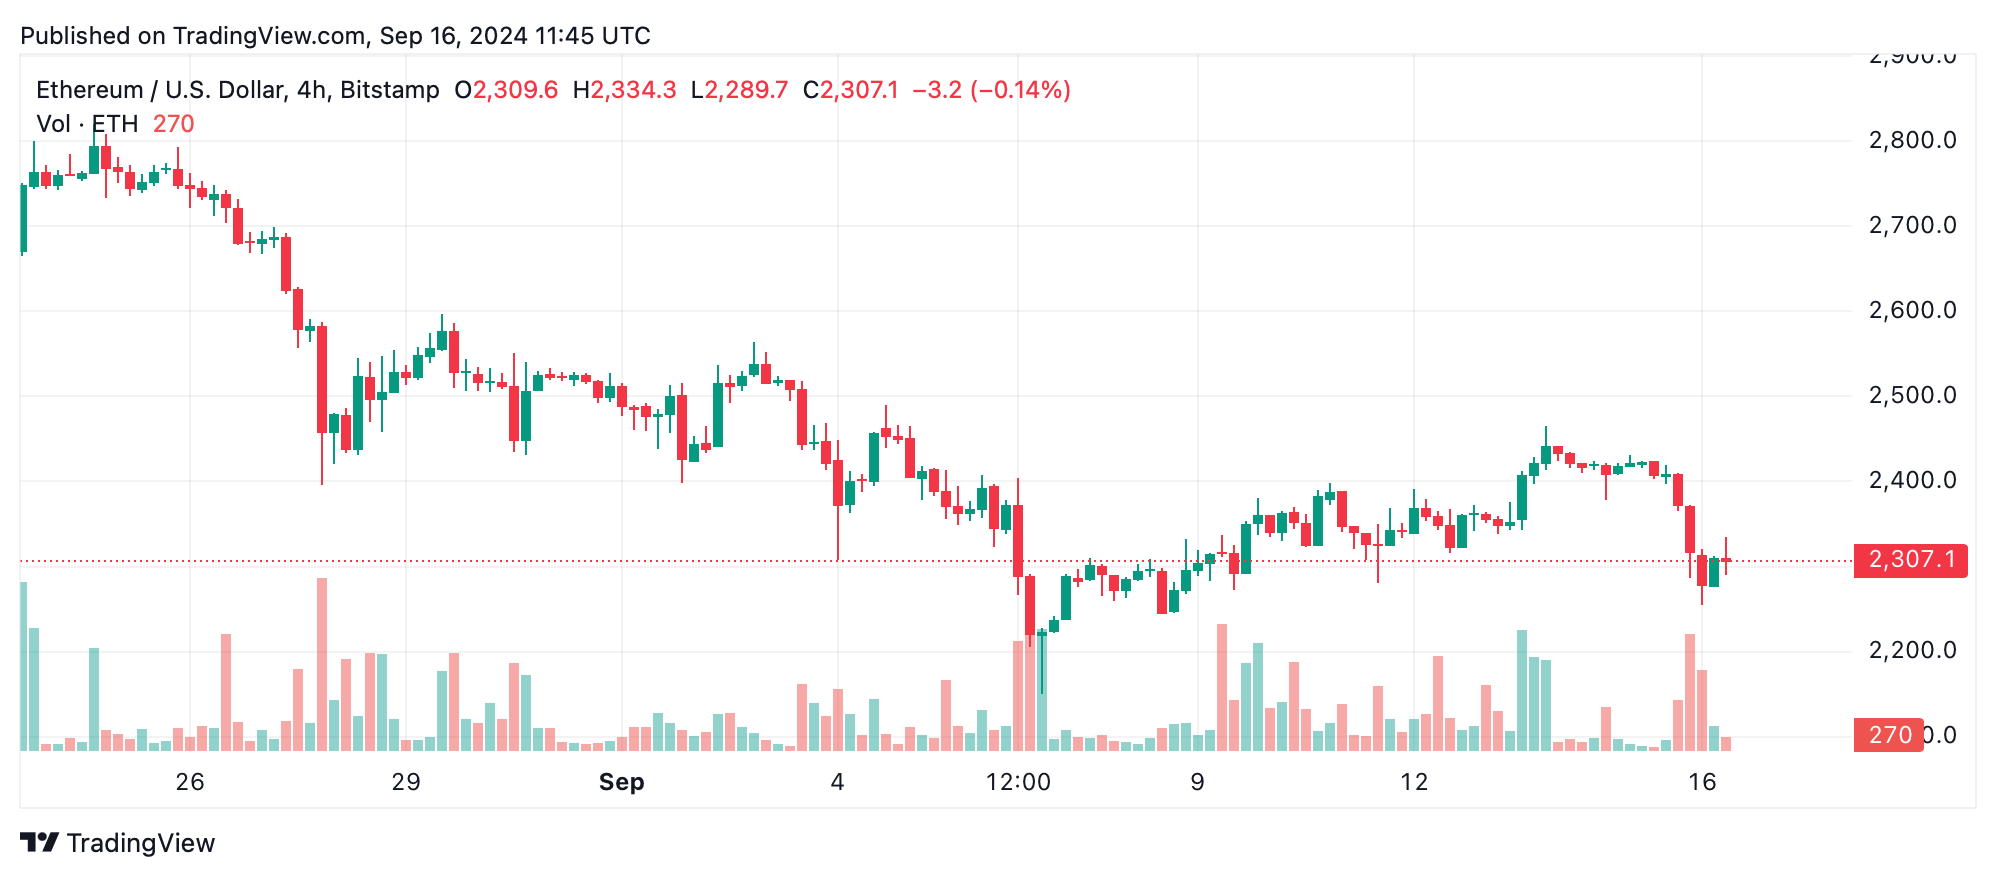
Switching to the 4-hour chart, ethereum’s fall from $2,468 to $2,251 is sharper, though the price has since entered a brief consolidation. As selling pressure eases, there are signs of bullish momentum, suggesting that sellers may be running out of steam. If $2,251 holds as support, traders might consider entering a position.

ETH/USD daily chart.
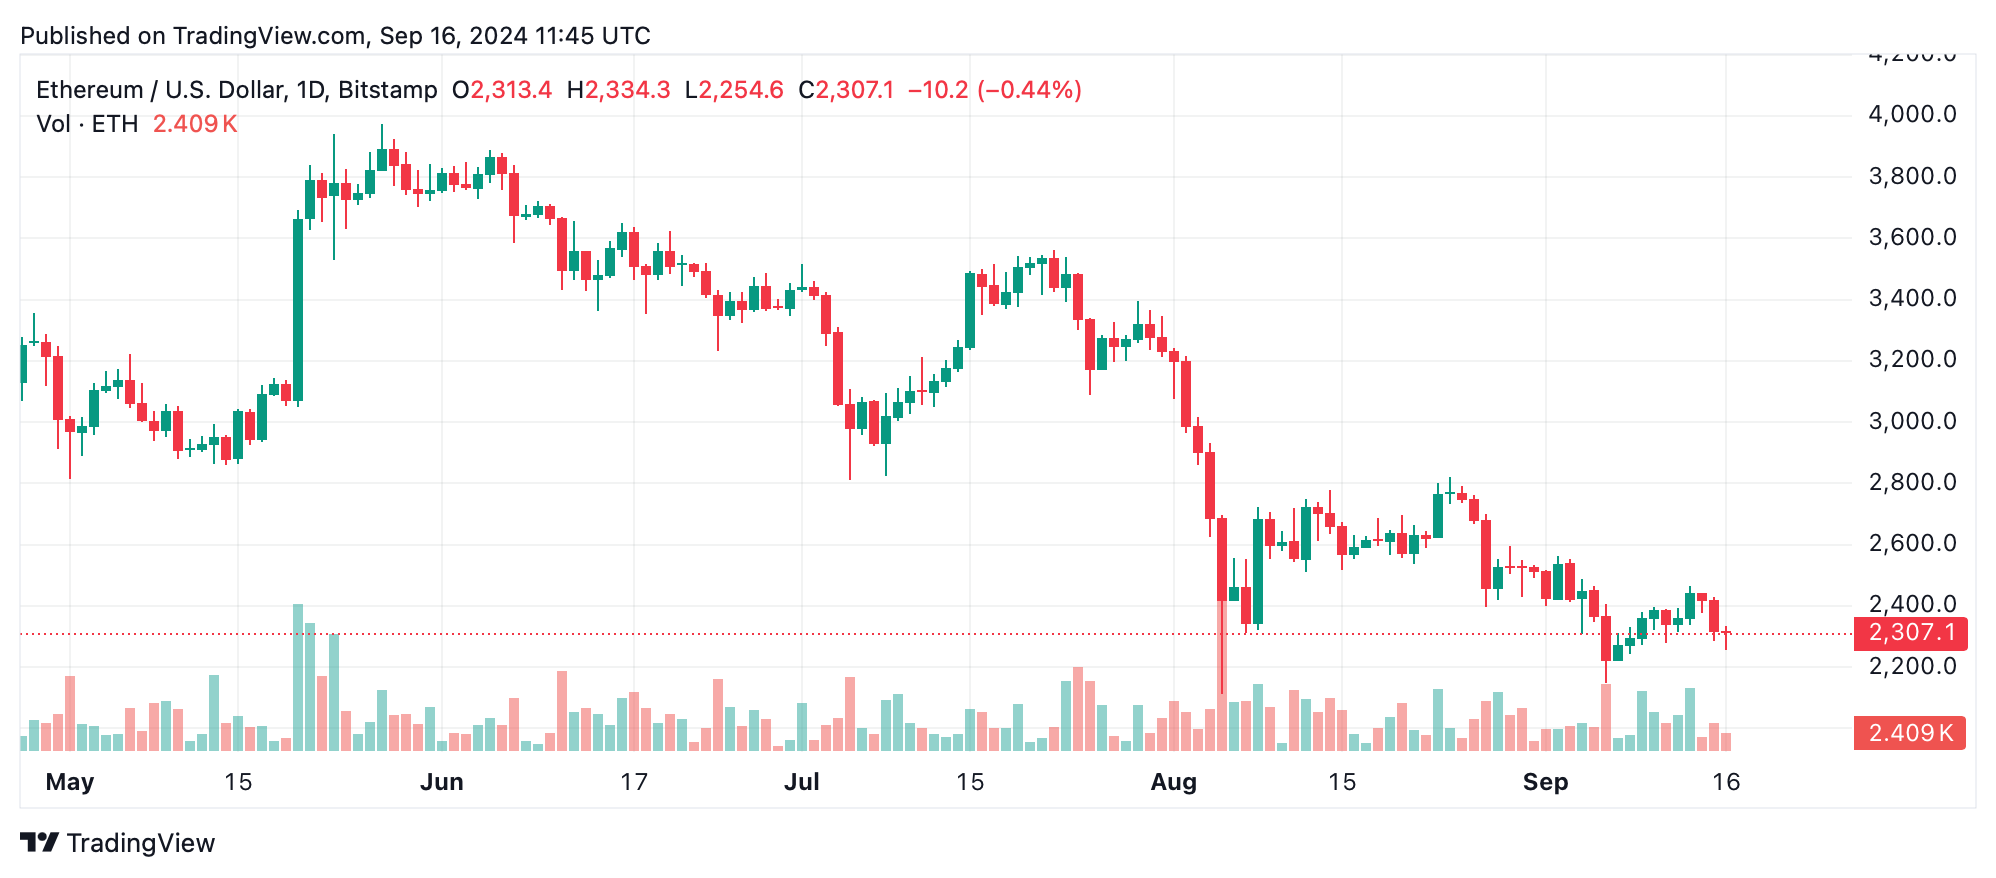
Looking at the broader picture, the daily chart reveals a long downtrend, with ether dropping from its high of $2,823 to a low of $2,149. The $2,149 level stands as critical support, while resistance looms near $2,823. If ethereum revisits the $2,149 zone, traders may find an entry opportunity, though caution is still advised.
As for technical indicators, the readings are a mixed bag. The relative strength index (RSI) sits at 39.8, Stochastic at 47.8, and commodity channel index (CCI) at -92.4, all hovering in neutral territory. However, momentum at 79.9 and moving average convergence divergence (MACD) at -81.0 hint at a possible bullish signal. Moving averages (MAs), from the 10-day to the 200-day, point to a continuing bearish trend, with ether’s price still lagging below these key levels.
Bull Verdict:
Despite the prevailing bearish sentiment, ether’s recent consolidation around $2,300 offers hope for short-term bullish moves. If price breaks above key resistance levels at $2,300 and $2,350, alongside sustained volume, ethereum traders could see a potential upward trend toward $2,400. Indicators like momentum and the MACD hint at buying pressure, suggesting the possibility of a short-term reversal.
Bear Verdict:
Ethereum remains firmly in bearish territory, with multiple MAs and overall trend indicators reinforcing downward pressure. The failure to break through significant resistance levels, combined with low trading volume and a weak market structure, suggests that the current downtrend may persist. A retest of the $2,149 support level appears likely in the coming sessions, with further downside risk ahead.


 Bitcoin
  Ethereum
  Tether
  USDC
USDC  Dogecoin
  Cardano
  TRON
TRON  Chainlink
  Bitcoin Cash
  LEO Token
  Litecoin
  Dai
Dai  Stellar
  Monero
  Ethereum Classic
  Cronos
  Stacks
  OKB
OKB  Hedera
  Cosmos Hub
  Maker
Maker  KuCoin
  Theta Network
  Gate
Gate  Algorand
  Polygon
  NEO
NEO  EOS
EOS  Tether Gold
  Tezos
Tezos  Zcash
Zcash  Synthetix Network
  TrueUSD
  IOTA
IOTA  Bitcoin Gold
  Holo
Holo  Dash
Dash  0x Protocol
  Zilliqa
  Siacoin
  Enjin Coin
  Ravencoin
  Basic Attention
  Qtum
Qtum  Decred
  Ontology
  NEM
NEM  Lisk
Lisk  Nano
Nano  Numeraire
  Waves
Waves  Pax Dollar
  DigiByte
  Status
  Huobi
Huobi  Hive
Hive  Steem
Steem  BUSD
BUSD  Ren
Ren  OMG Network
  Bitcoin Diamond
  Bytom
Bytom  Kyber Network Crystal Legacy
  HUSD
HUSD