GOAT Surges 17% Following OKX Listing News, Eyes $1 Target

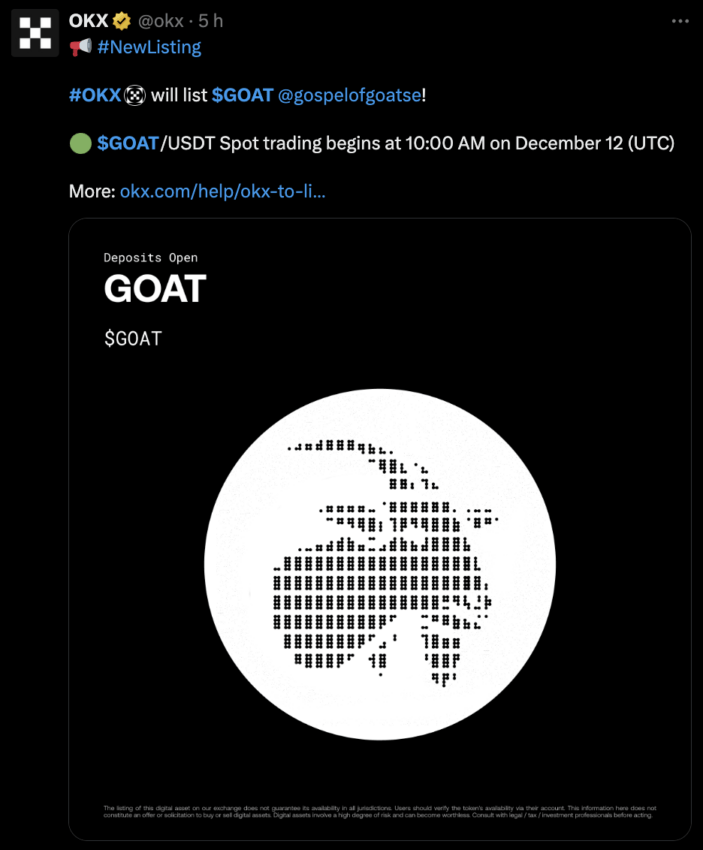
GOAT’s price jumped approximately 17% after OKX announced the listing of the GOAT/USDT spot pair on December 12. This development adds to the token’s ongoing recovery from a recent sharp correction, fueling optimism for further gains.
Key indicators such as the Average Directional Index (ADX) and Relative Strength Index (RSI) point to strengthening momentum, with bullish activity beginning to take shape. The coming days will be crucial in determining whether the listing drives GOAT to surpass resistance levels and aim for prices above $1.
GOAT Listing Announcement Could Spark New Surge
GOAT price jumped roughly 17% after OKX tweeted that it would be listing its USDT spot pair on December 12. The meme coin, which was already recovering from a recent correction, could see new sparks depending on how some metrics will play in the next days.

OKX Tweet Announcing GOAT’s Listing. Source: Twitter.
GOAT’s ADX surged above 32 on December 10, signaling the strength of a significant downtrend that resulted in a 40% price correction over just three days. Still, GOAT remains the biggest meme coin initially launched on Pump.fun in terms of market cap.
This sharp drop reflected intense selling pressure, and ADX levels indicated strong and sustained bearish momentum during that period.

GOAT ADX. Source: TradingView
ADX, or Average Directional Index, measures trend strength without considering direction. Values below 20 indicate a weak or non-existent trend, while readings above 25 point to a stronger trend.
If this trend strengthens, GOAT price could see short-term recovery as bullish momentum builds, though the relatively low ADX value indicates that the new trend is still in its early stages and needs further confirmation.
GOAT RSI Isn’t In The Overbought Zone Yet
GOAT’s RSI reached 24 on December 10, signaling oversold conditions after a period of significant selling pressure. However, it has since recovered and is now at 58.7, indicating a return to more neutral territory. This shift suggests that selling momentum has eased, and the coin is regaining stability as buying activity picks up.

GOAT RSI. Source: TradingView
RSI, or Relative Strength Index, measures the speed and magnitude of price changes to assess whether an asset is overbought or oversold. Values below 30 indicate oversold conditions, often signaling potential buying opportunities, while values above 70 suggest overbought levels, which can lead to selling pressure.
With an RSI of 58.7, GOAT is approaching bullish territory but remains below overbought levels. This position could indicate room for further upward movement in the short term, provided buying interest continues to support the recovery.
GOAT Price Prediction: Levels Above $1 Are Hard, But Not Impossible
GOAT price is currently trading within a range, finding support at $0.65 and facing key resistance at $0.87. If this resistance is broken, the price could climb to test $0.95, and a successful breakout beyond that could push GOAT toward $1.27 for the first time in weeks.
Such a move would represent a potential upside of nearly 70%, signaling strong bullish momentum if the uptrend gains traction.

GOAT Price Analysis. Source: TradingView
However, maintaining the $0.65 support level is crucial for sustaining the current uptrend. A failure to hold this level could result in GOAT dropping below $0.6, signaling potential weakness.
Monitoring its EMA lines is also important, as the shortest-term EMA is nearing a bullish crossover. If this crossover occurs, it could act as a catalyst for a surge, further increasing the likelihood of breaking resistance levels and continuing the upward trajectory.


 Bitcoin
  Ethereum
  Tether
  USDC
USDC  Dogecoin
  Cardano
  TRON
TRON  LEO Token
  Chainlink
  Stellar
  Hedera
  Litecoin
  Bitcoin Cash
  Monero
  Dai
Dai  OKB
OKB  Cronos
  Gate
Gate  Ethereum Classic
  VeChain
  Cosmos Hub
  Algorand
  KuCoin
  Maker
Maker  Stacks
  Theta Network
  Tether Gold
  Tezos
Tezos  IOTA
IOTA  Zcash
Zcash  TrueUSD
  NEO
NEO  Polygon
  Synthetix Network
  Dash
Dash  Zilliqa
  Qtum
Qtum  0x Protocol
  Basic Attention
  Decred
  Holo
Holo  DigiByte
  Siacoin
  Ravencoin
  NEM
NEM  Enjin Coin
  Ontology
  Waves
Waves  Nano
Nano  Hive
Hive  Lisk
Lisk  Status
  Pax Dollar
  Huobi
Huobi  Numeraire
  Steem
Steem  BUSD
BUSD  OMG Network
  Ren
Ren  Bitcoin Diamond
  Bitcoin Gold
  Augur
Augur  HUSD
HUSD