Is $525 Level Within Reach For AAVE Crypto As Whales Re-enter Market?

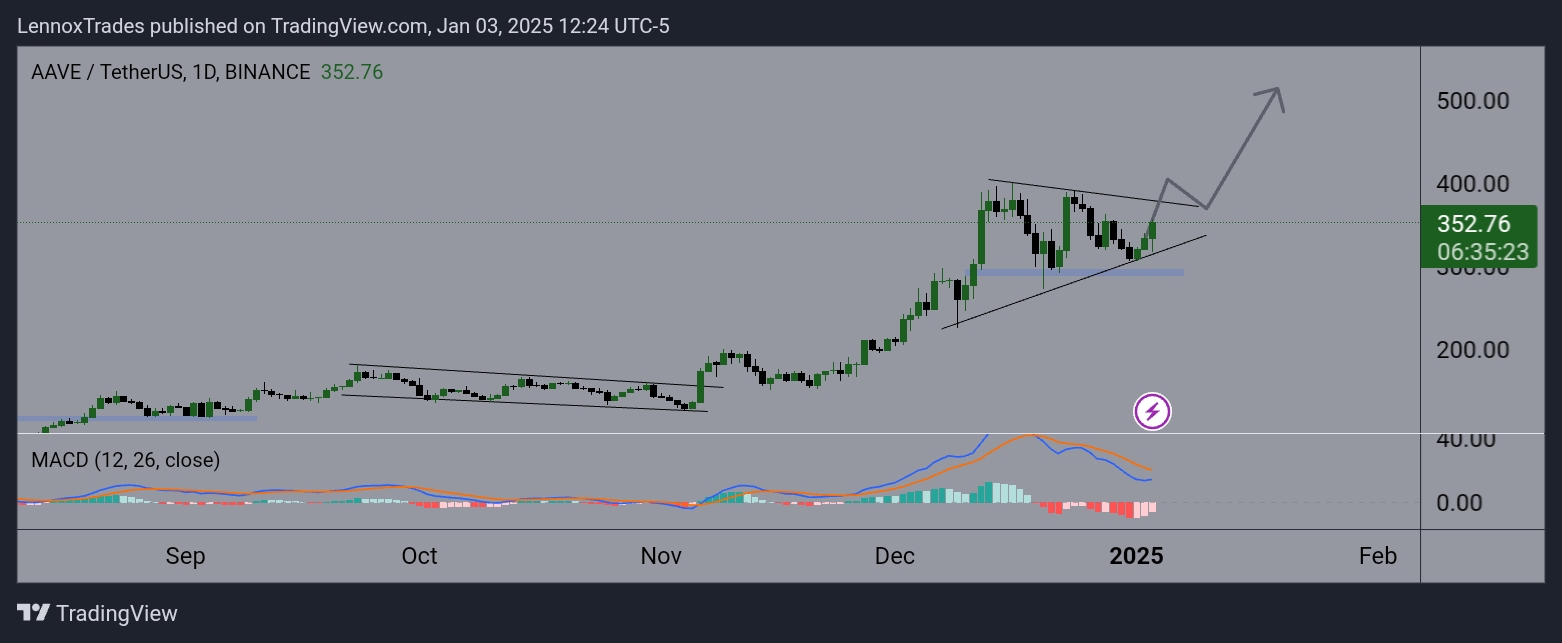
The analysis of the price action chart of AAVE crypto showed consolidation within a symmetrical triangle, indicating potential market equilibrium between buyers and sellers.
AAVE’s price fluctuated between well-defined support around $280 and resistance near $525, suggesting significant volatility within this consolidation zone.
The triangle’s apex appeared near the current price of $352.76, serving as a crucial breakout point that could define AAVE’s short-term price trajectory.
If AAVE breaks upward from the triangle, price movement could extend to the triangle’s height added above the breakout point, potentially propelling past $525, reinforcing bullish sentiments.

AAVE/USDT daily chart | Source: Trading View
The Moving Average Convergence Divergence (MACD) indicators, currently nearing a bullish crossover beneath the zero line, support the possibility of an upward breakout.
This bullish signal, if confirmed, could catalyze further buying pressure. A decisive close above the triangle could attract heightened trading activity, pushing AAVE towards the $525 level.
– Advertisement –
Conversely, failure to surpass this resistance could lead to a retest of lower support levels. Watching the MACD and volume can provide additional confirmation on whether the breakout will sustain, offering traders insights into upcoming price dynamics.
This analysis provides a structured outlook on AAVE’s possible future movements based on its current market behavior.
AAVE Crypto Whale Accumulation
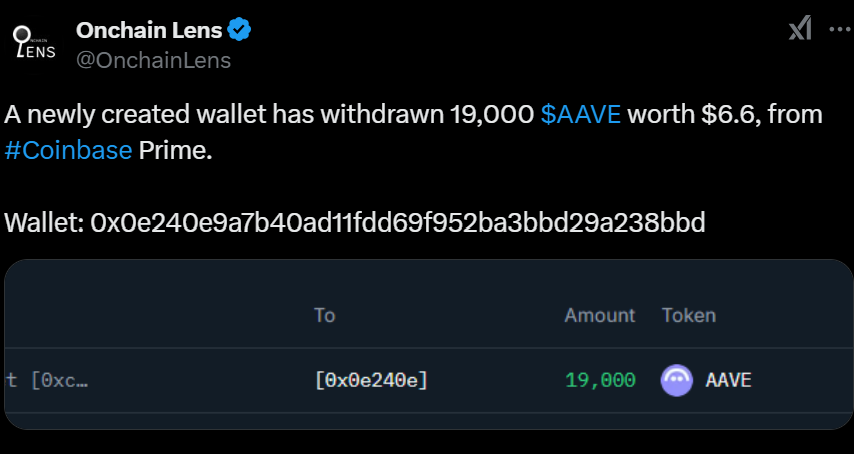
In the recorded transaction, a newly created wallet withdrew 19,000 AAVE, valued at $6.6 million, from Coinbase Prime, indicating a potential accumulation phase.
This large movement suggested growing investor interest, which could increase buy pressure on the AAVE token.

Source: X
If this trend continues, coupled with broader market acceptance and favorable trading conditions, AAVE could experience a significant price rally.
Similar large transfers have often correlated with increased market activity and price spikes, making a surge past $525 a plausible scenario, particularly if followed by continued institutional or whale interest in AAVE.
Yearly Revenue of AAVE
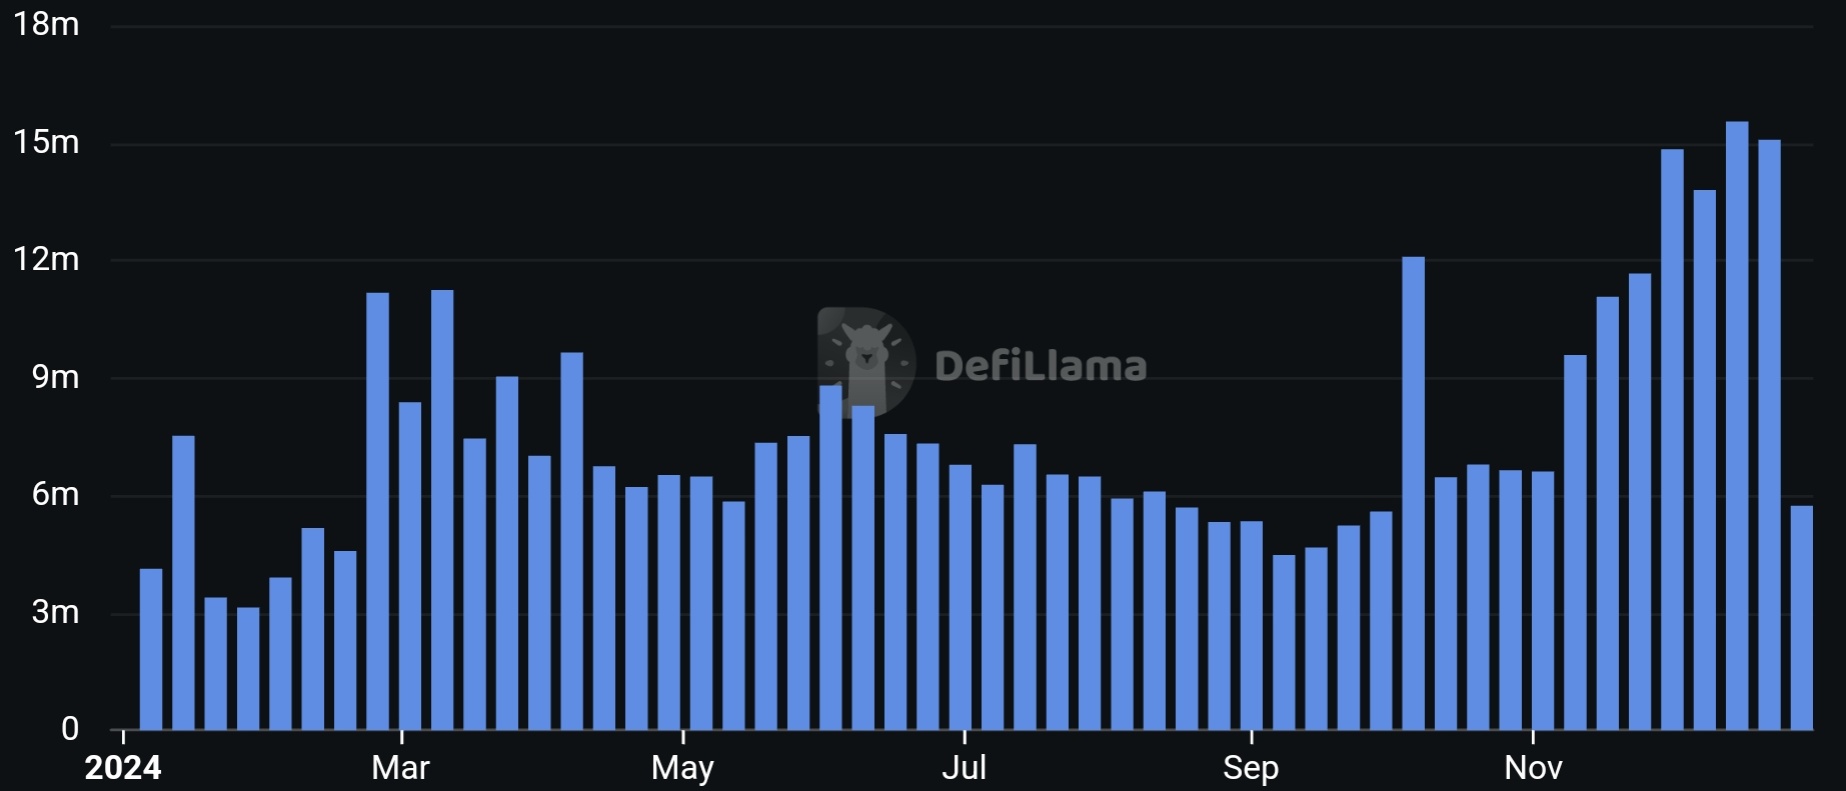
AAVE’s revenue trajectory over the last year, showed an uptrend with significant peaks and troughs. Each peak correlated with market optimism and subsequent utility spikes.
The November peak stood out, showing huge increase before a sharp decline, hinting at a volatile yet robust growth period for AAVE in terms of transactional throughput.

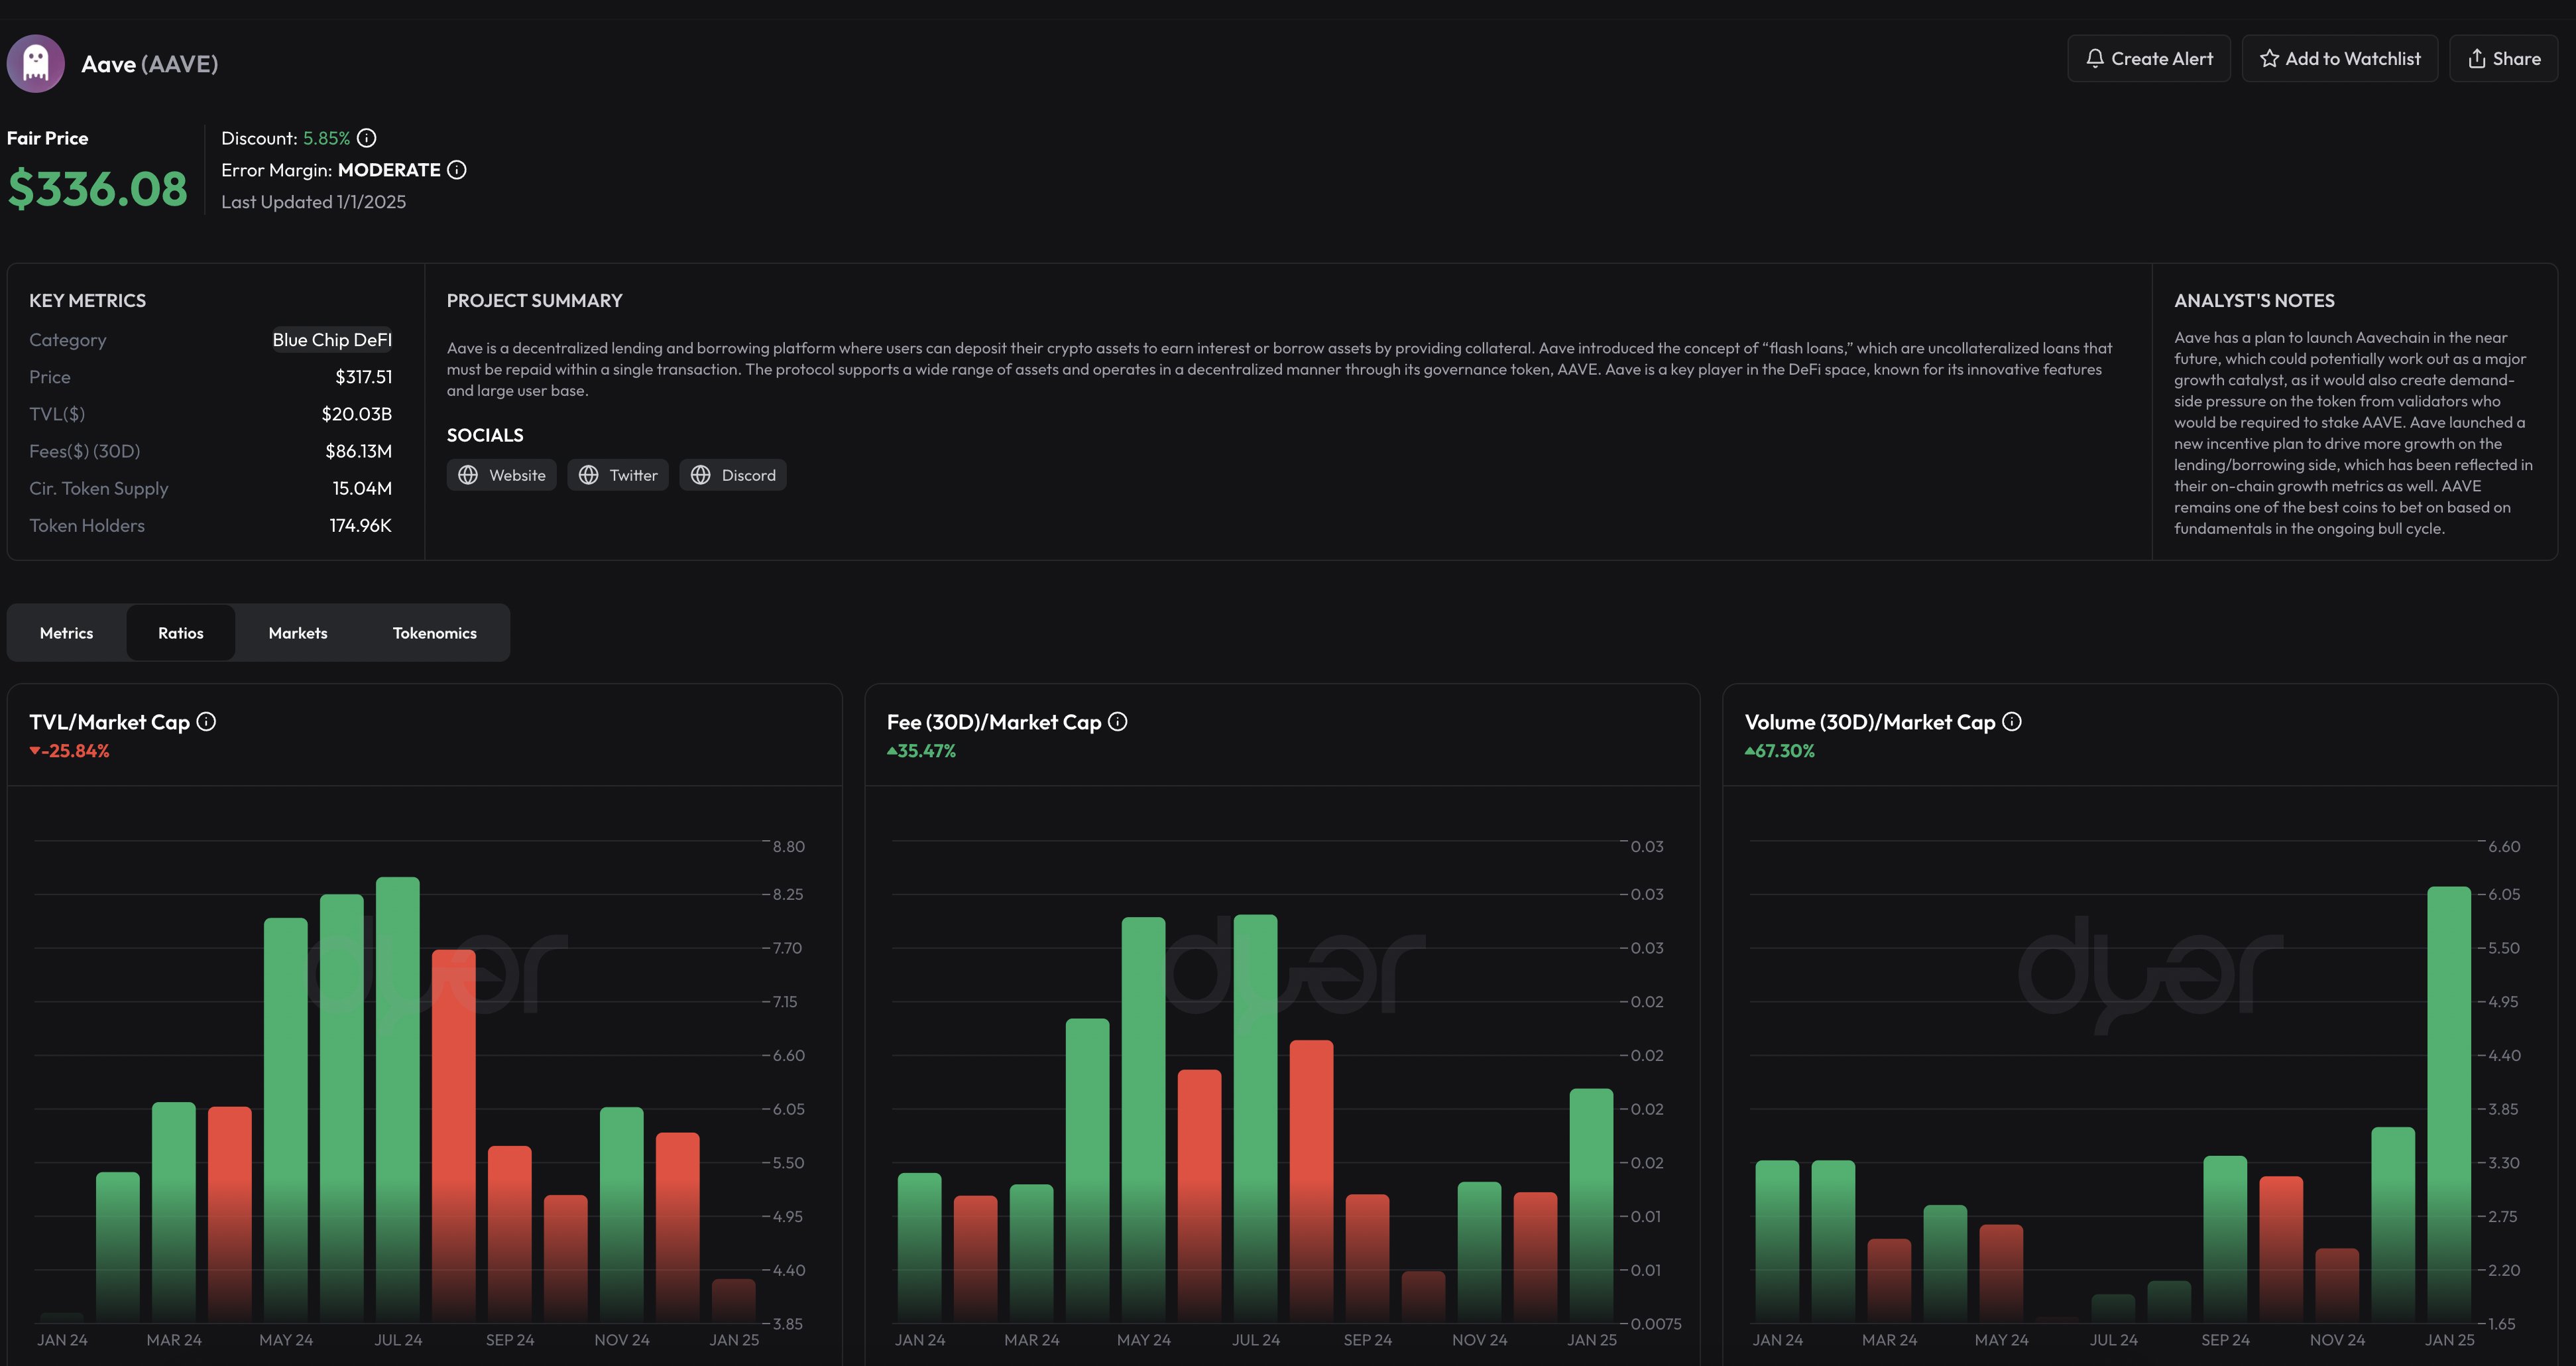
The Fees/Market Cap ratio has increased by 35% over the last 30 days, reflecting a growing revenue stream against a stable or slightly increasing market cap. This suggested efficient capital utilization, boosting investor confidence.
The Volume/Market Cap has also seen a 67% increase in the same period, a significant surge, demonstrating heightened trading activity which often precedes price volatility or a bullish trend.

These collectively suggested a robust economic condition within the AAVE ecosystem. As transaction volumes and fee contributions to the market cap increase, AAVE’s financial health appears strong.
Should these trends persist, AAVE could witness substantial price action, potentially rallying beyond the $525 mark as market conditions favor further growth driven by solid fundamentals and increasing trader and investor engagement.


 Bitcoin
  Ethereum
  Tether
  Dogecoin
  USDC
USDC  Cardano
  TRON
TRON  Chainlink
  Stellar
  Hedera
  Bitcoin Cash
  Litecoin
  LEO Token
  Cronos
  Ethereum Classic
  Monero
  Algorand
  Dai
Dai  OKB
OKB  Cosmos Hub
  Stacks
  Theta Network
  Gate
Gate  Tezos
Tezos  Maker
Maker  KuCoin
  IOTA
IOTA  NEO
NEO  Polygon
  Zcash
Zcash  Synthetix Network
  Tether Gold
  Dash
Dash  TrueUSD
  Holo
Holo  Zilliqa
  0x Protocol
  Enjin Coin
  Basic Attention
  Siacoin
  Qtum
Qtum  Ravencoin
  Hive
Hive  Decred
  DigiByte
  Bitcoin Gold
  NEM
NEM  Ontology
  Huobi
Huobi  Nano
Nano  Status
  Waves
Waves  Lisk
Lisk  Steem
Steem  Numeraire
  Pax Dollar
  BUSD
BUSD  OMG Network
  Ren
Ren  Bitcoin Diamond