Pepe Coin Price Prediction: Will $PEPE Reclaim $0.0000014 By Feb End?

Pepe Coin Price Prediction: Over the last two months, the frog-themed meme cryptocurrency PEPE has experienced a consistent decline on the daily chart. It fell nearly 50% from a high of $0.00000175 to a low of $0.00000086, significantly impacting investors. However, analysis of the technical charts reveals this downtrend as part of a key reversal pattern, suggesting a potential turnaround and opening up opportunities for buyers to make a comeback.
Also Read: Meme Coin Price Prediction: Future of Meme Coins Analyzed
Will PEPE Price Hold the $0.000001 Support?

PEPE Price| Tradingview
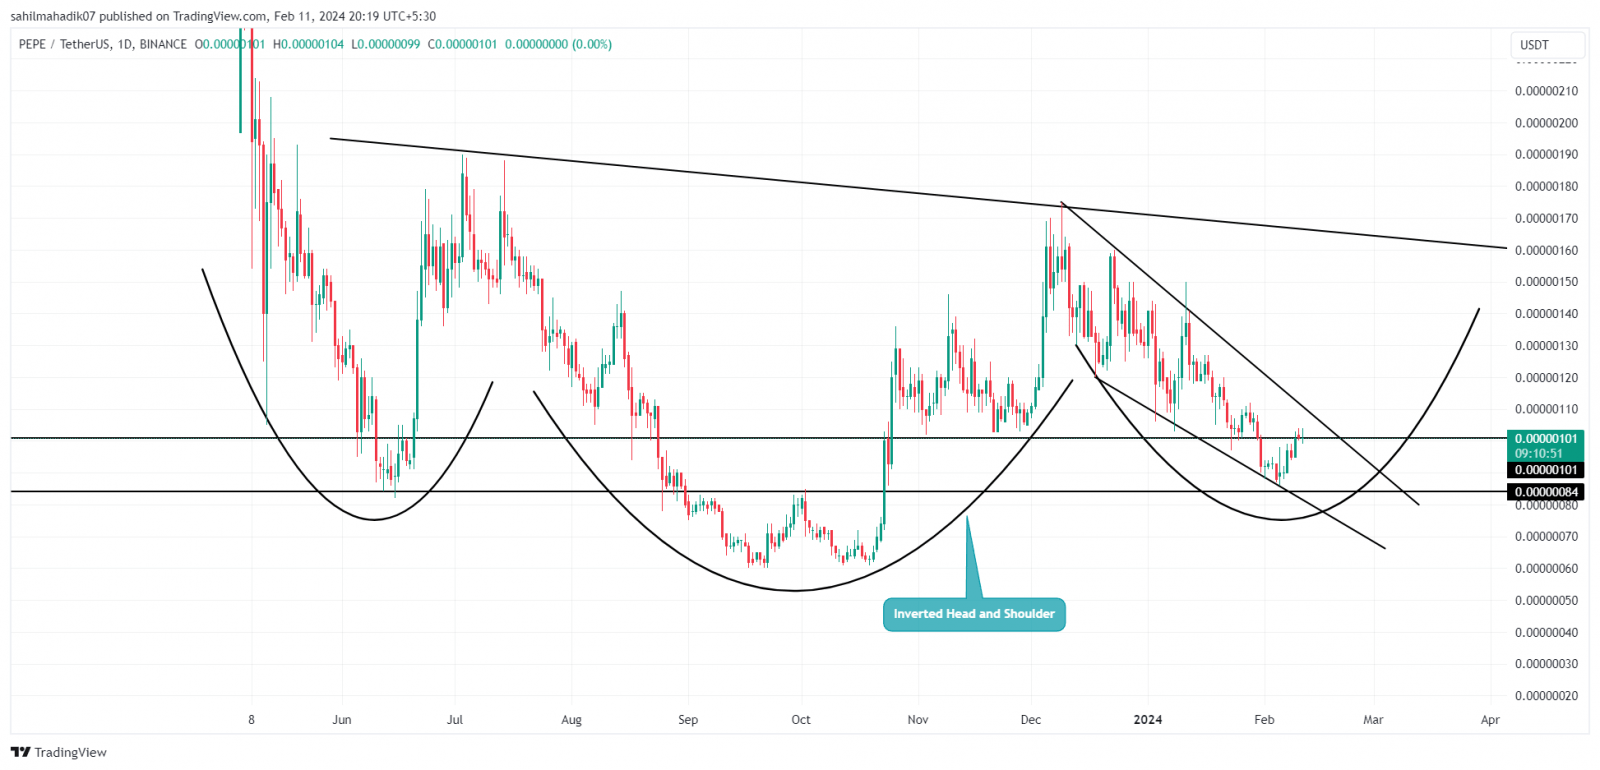
According to a recent analysis by @alichart, $PEPE cryptocurrency is showing technical signs of an upcoming bullish trend on its 3-day chart. It’s forming the right shoulder of a head-and-shoulders pattern, and the TD Sequential indicator has issued a buy signal.
This combination of factors suggests a potential upward momentum for $PEPE, making it a point of interest for traders and investors alike. The inverted head and shoulders pattern signals a bullish reversal at a downtrend’s end, featuring three troughs with the central one deepest.
$PEPE is currently showing signs of forming the right shoulder of a head-and-shoulders pattern on its 3-day chart. Additionally, the TD Sequential indicator has issued a buy signal within this timeframe, suggesting an anticipated bullish impulse for #PEPE. pic.twitter.com/brSr7uln3z
— Ali (@ali_charts) February 10, 2024
Amid the renewed recovery in the crypto market, the PEPE price has surged from $0.00000086 to $0.00000102, registering a 16% weekly gain. If the pattern holds true, the Pepe price should rise to the neckline resistance at $0.00000162, resisting a potential gain of 55%.
Also Read: Crypto Prices Today: Bitcoin Crosses $47K, Ethereum At $2.5K, PEPE Recovers As Bonk Leads Rally
When Will PEPE Price Recovery Start?

PEPE Price| Tradingview
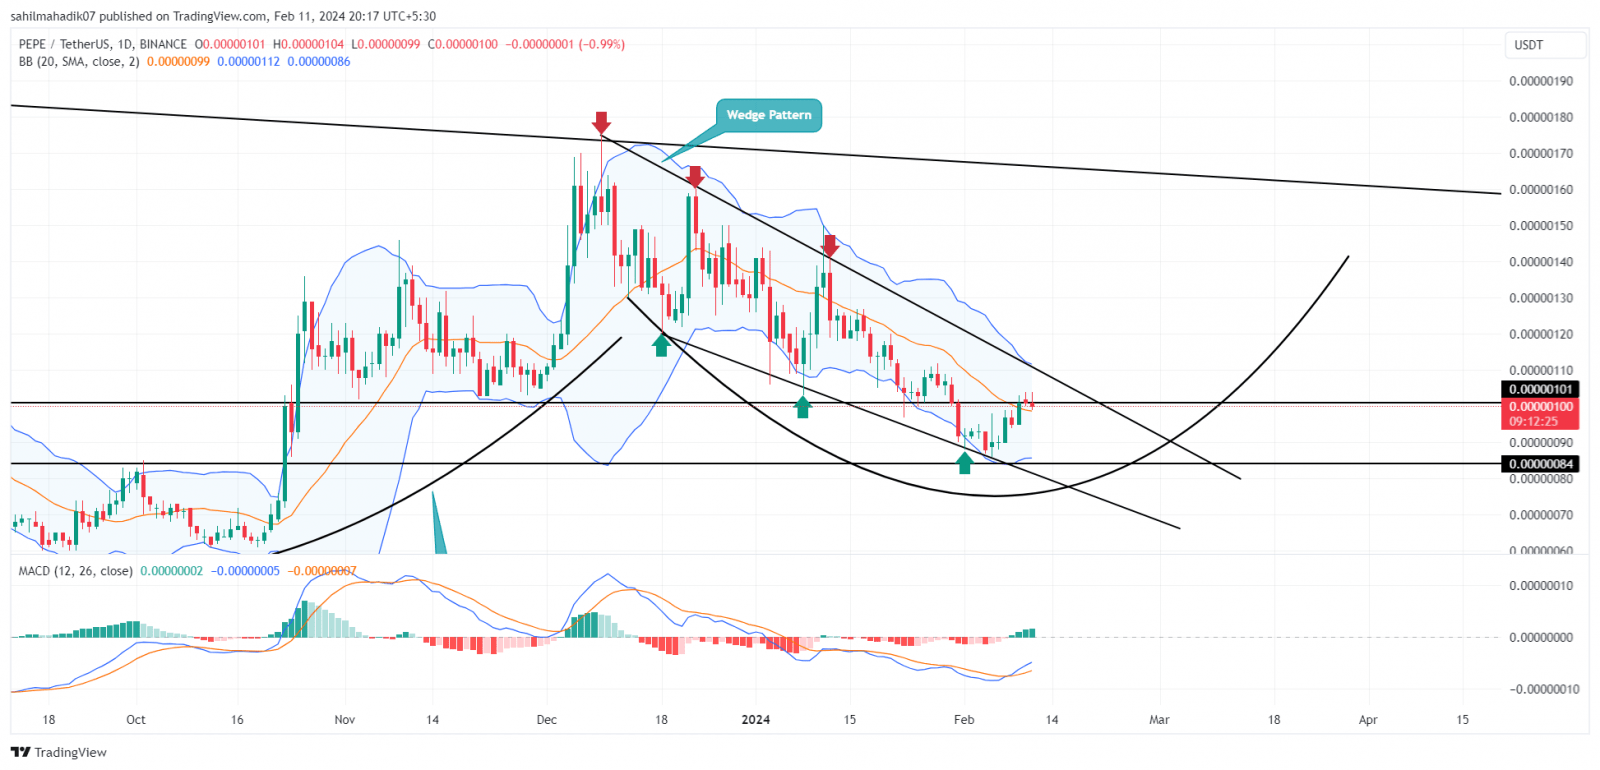
In a deeper analysis of the Daily time frame chart, the ongoing correction in Pepe Price is resonating within the two converging trend lines of a falling wedge pattern. In theory, this chart pattern is another setup that hints at the maturity of a correction trend and the potential for higher recovery. Under favorable bullish conditions, the paper price should signal the start of a fresh recovery trend, providing new long-entry opportunities to traders.
Depending on the time of breakout, the PEPE price will need 2-3 weeks before reclaiming the $0.0000014 mark
- Bollinger band: An upswing in the lower boundary of the Bollinger band indicator provides additional support for PEPE buyers at $0.00000084.
- Moving Average Convergence Divergence: A bullish crossover state between the MACD and signal line, reflects an early sign of recovery from buyers.


 Bitcoin
  Ethereum
  Tether
  Dogecoin
  USDC
USDC  Cardano
  TRON
TRON  Chainlink
  Stellar
  Hedera
  Bitcoin Cash
  LEO Token
  Litecoin
  Cronos
  Ethereum Classic
  Monero
  Dai
Dai  Algorand
  OKB
OKB  Cosmos Hub
  Stacks
  Theta Network
  Gate
Gate  Maker
Maker  KuCoin
  Tezos
Tezos  IOTA
IOTA  NEO
NEO  Zcash
Zcash  Polygon
  Synthetix Network
  Tether Gold
  TrueUSD
  Dash
Dash  Holo
Holo  Zilliqa
  Enjin Coin
  0x Protocol
  Siacoin
  Qtum
Qtum  Basic Attention
  Ravencoin
  Bitcoin Gold
  Decred
  NEM
NEM  DigiByte
  Ontology
  Nano
Nano  Waves
Waves  Status
  Huobi
Huobi  Lisk
Lisk  Hive
Hive  Numeraire
  Steem
Steem  Pax Dollar
  BUSD
BUSD  OMG Network
  Ren
Ren  Bitcoin Diamond
  Bytom
Bytom