Solana Price Gains Over 500% in 1 Year Despite Massive Outflows: What’s Next?

Even in a year that saw whale and institutional investors pull out their funds, Solana (SOL) price has stood strong. SOL price grew by more than 500%.
A whale/institution sold 695K $SOL($99.5M) this year!
Since Jan 1, this whale/institution has been selling an average of 19,306 $SOL($2.76M) weekly, totaling nearly $100 million worth of $SOL!
The whale/institution still has 1.88M $SOL($255.89M) staked.https://t.co/v6mJegPKCa… pic.twitter.com/3XHhPQJbdq
— Lookonchain (@lookonchain) September 3, 2024
From the most recent transactions, it was seen that a whale or an institutional player liquidated 695,000 SOL tokens. This was roughly $99.5 million, adding to the list of whale dumping. This massive selloff has led to debates among investors on the effects of this situation on Solana’s price trend.
Nevertheless, Solana’s value has increased by 594% in the last year alone. At the same time, the number of its active addresses has reduced. This indicated its resilience in sales and the ability to attract more investors.
Solana Price Performance Amidst Market Challenges
Solana has remained the most outstanding in 2024 despite the many odds. This is even though major holders have been liquidating their holdings, and SOL has continued to rise.
When writing this article, Solana is valued at $134.66, reflecting a 1.99% increase in the last day, according to CoinMarketCap. The market cap has also shown a 1.96% increase in the total, currently at about $62.84 billion.
This upward movement comes at the back of a decrease in trading volume. Trade volume reduced by 34.23% to $1.59 billion in the last day. This volume reduction implies a lull in trading activities. Yet the market capitalization keeps rising, thus depicting confidence from the investors.
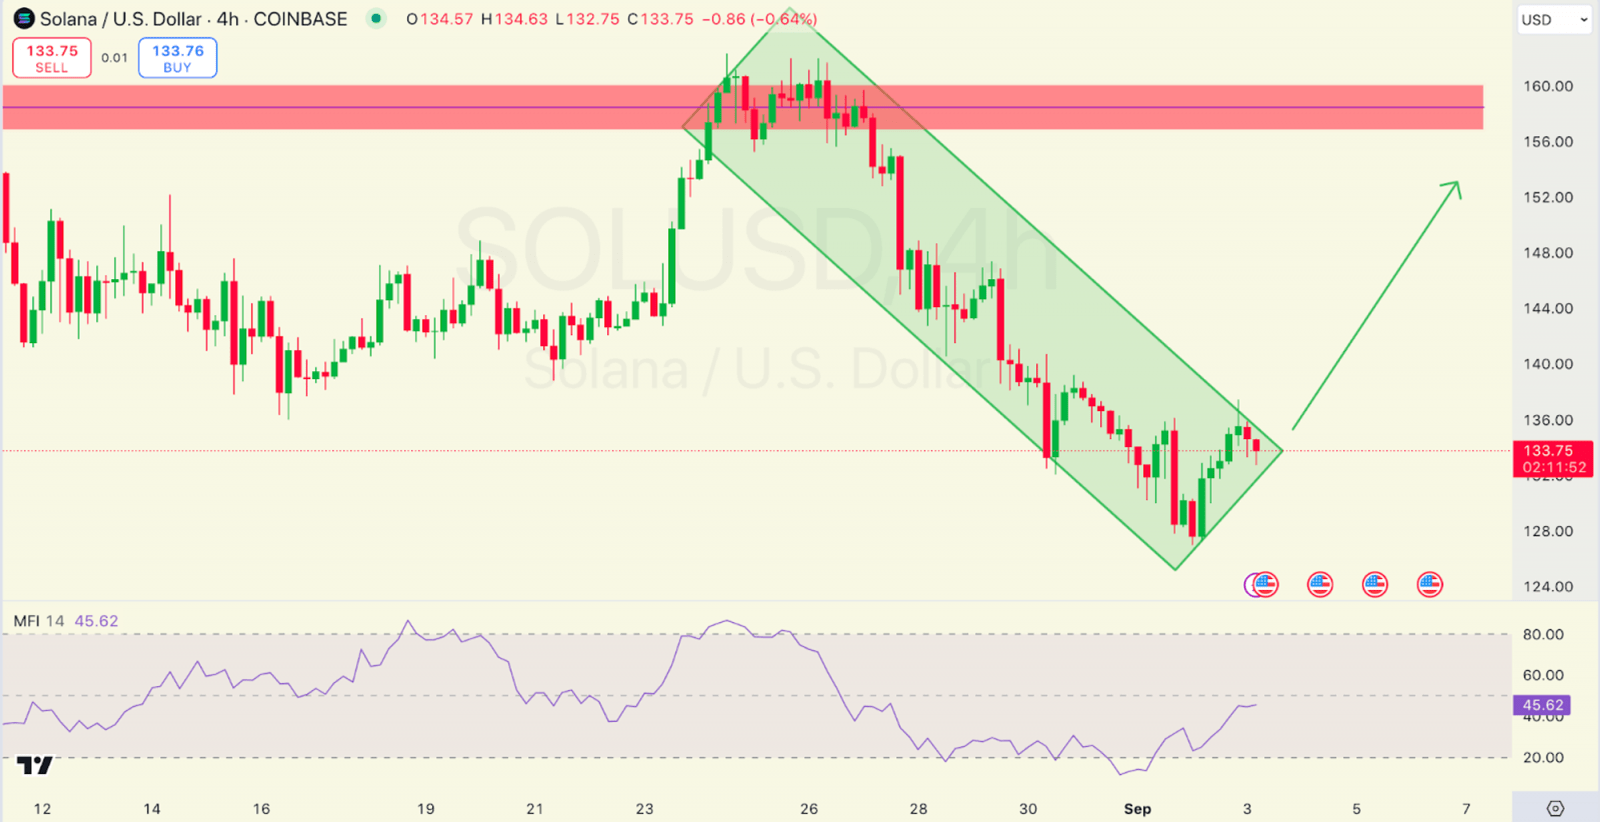
The current price action reveals that Solana is in the process of a breakout from the falling wedge pattern. This may be interpreted as a bullish signal. In the 4-hour chart of SOL/USD on Coinbase, we see this falling wedge and the downward channel formed.
The price of Solana is close to the apex of the wedge, and traders are getting more and more confident that the price will break out towards the upside. The Money Flow Index (MFI) at the time of writing was 45.62. It meant the selling pressure may diminish, thus presenting a buying opportunity.
Technical Indicators Pointing to a Bullish Outlook
From the technical analysis, the present price of Solana might be building a base that will lead to a breakout. The falling wedge pattern seen on the 4-hour chart is usually a bullish continuation pattern. If SOL breaks through the upper trendline, there could be a massive upward move.
The price currently hovers at the bottom of the rising wedge. It makes it possible to expect some kind of bottoming out at around $132 to $134.

Solana Price 4-hour SOL/USD Chart | Source: TradingView
Also, the MFI, a volume-weighted relative strength index, is in the middle range, which shows that there is no net inflow or outflow of money in the asset.
This means that although there has been massive selling pressure recently, it has not been enough to cause the MFI to be oversold. Those who follow these indicators will probably wait for the breakout confirmation to jump into the market or add more positions.
The recent performance of Solana, which has seen it rally by over 500% in the last year, has given it a strong standing in the cryptocurrency market.
Nonetheless, Solana, whose ETF is now in anticipation, has been seen to rebound very strongly and is proving that it can hold its ground even in the face of massive outflows from the wallets of large holders. This is in light of the falling wedge pattern that is currently being observed on the chart and the current technical strategy.


 Bitcoin
  Ethereum
  Tether
  Dogecoin
  USDC
USDC  Cardano
  TRON
TRON  Chainlink
  Stellar
  Hedera
  Bitcoin Cash
  LEO Token
  Litecoin
  Cronos
  Ethereum Classic
  Monero
  Dai
Dai  Algorand
  OKB
OKB  Cosmos Hub
  Stacks
  Theta Network
  Gate
Gate  Maker
Maker  KuCoin
  Tezos
Tezos  IOTA
IOTA  NEO
NEO  Polygon
  Zcash
Zcash  Synthetix Network
  Tether Gold
  TrueUSD
  Dash
Dash  Holo
Holo  Zilliqa
  0x Protocol
  Enjin Coin
  Siacoin
  Qtum
Qtum  Basic Attention
  Bitcoin Gold
  Ravencoin
  Decred
  NEM
NEM  DigiByte
  Ontology
  Waves
Waves  Nano
Nano  Status
  Huobi
Huobi  Lisk
Lisk  Hive
Hive  Numeraire
  Steem
Steem  Pax Dollar
  BUSD
BUSD  OMG Network
  Ren
Ren  Bitcoin Diamond
  Bytom
Bytom