Where Solana Price is Heading by the February End, $90 to $130?

While the broader market remains volatile, the Solana price showed strong resilience above the $106 support. The morning star candle at this horizontal level reflects the recovery trend witnessed sufficient demand pressure at dips to continue to the forward march. Can buyers maintain this momentum if the Bitcoin price sparks a new correction from $52000?
Also Read: Solana and Filecoin Forge Partnership to Boost Decentralized Storage Solutions
Sustainable Recovery Sets Solana Price Leap to $125

Solana Price| Tradingview
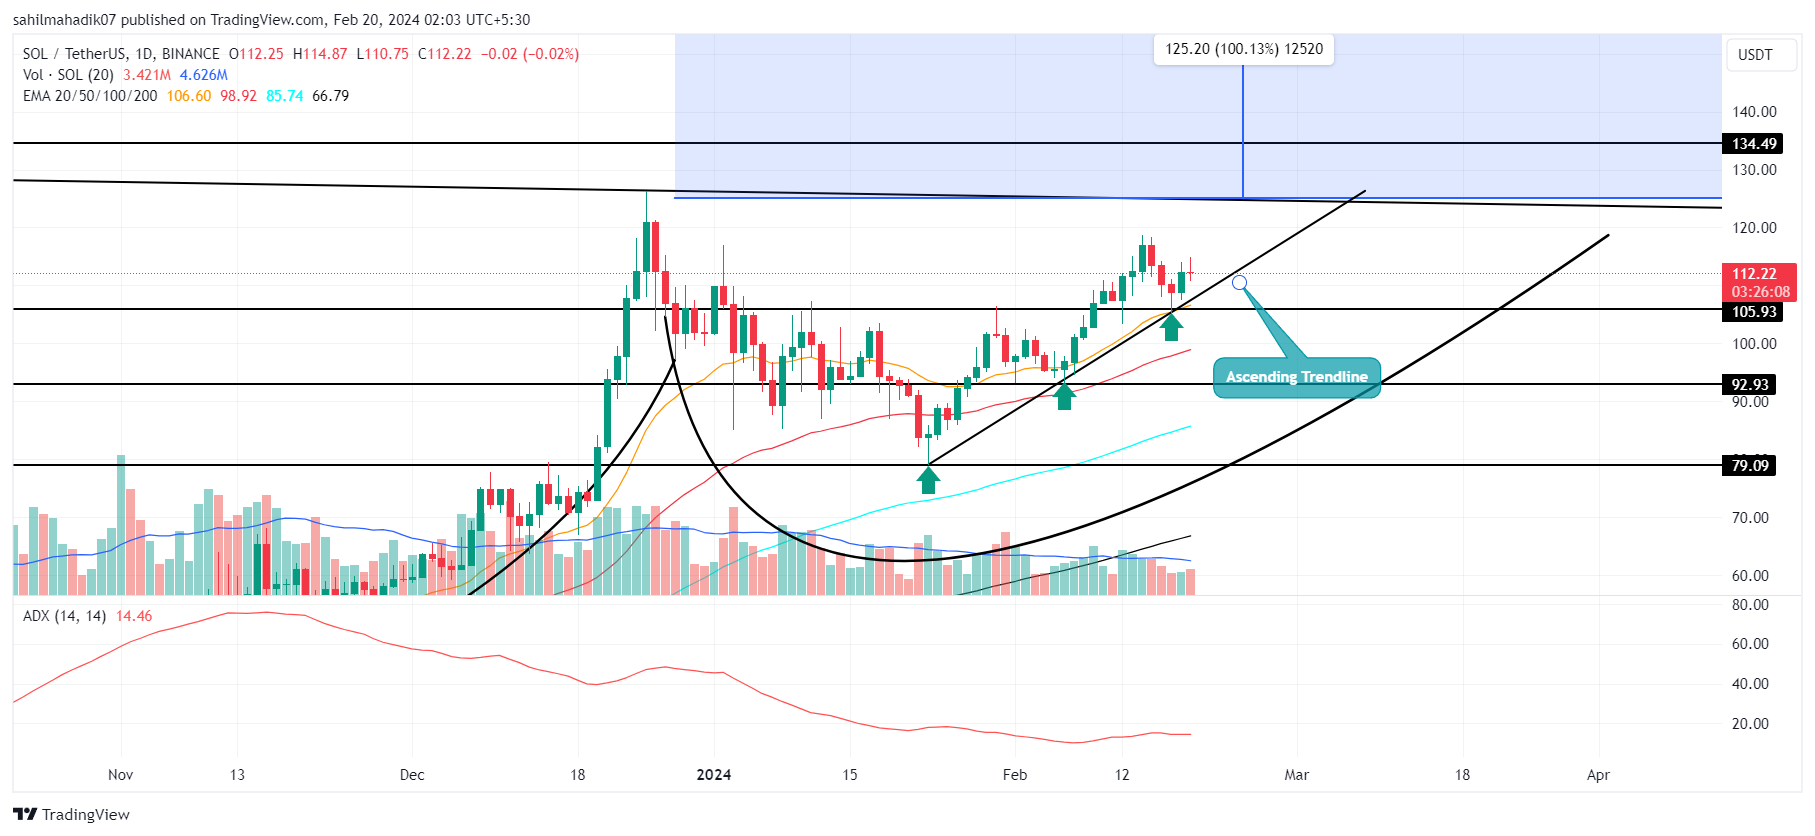
An analysis of the daily time frame chart shows the Solana coin made a quick rebound from the last correction phase as the buyer regained control at $79 support. A V-shaped recovery is a sign of aggressive momentum and uplifted the asset price by 42% within a month.
The renewed recovery regained 50% of the losses witnessed during the last pullback indicating the buyers continue to dominate this asset. Moreover, an ascending trendline is acting as a dynamic support to keep the recovery trend intact and extend the bull march.
On February 17th, the SOL price rebounded from the support trendline and 20-day EMA slope with a morning star candle pattern. If the recovery momentum persists, the buyers are likely to drive a 13% upswing to hit the neckline resistance of the cup and handle pattern at $125.
Also Read: Defi Pioneer Set To Rally 1000% Turns Solana (SOL) Investors Heads As They Jump On Board
Cup and Handle Pattern Carries Current Recovery

Solana Price| Tradingview
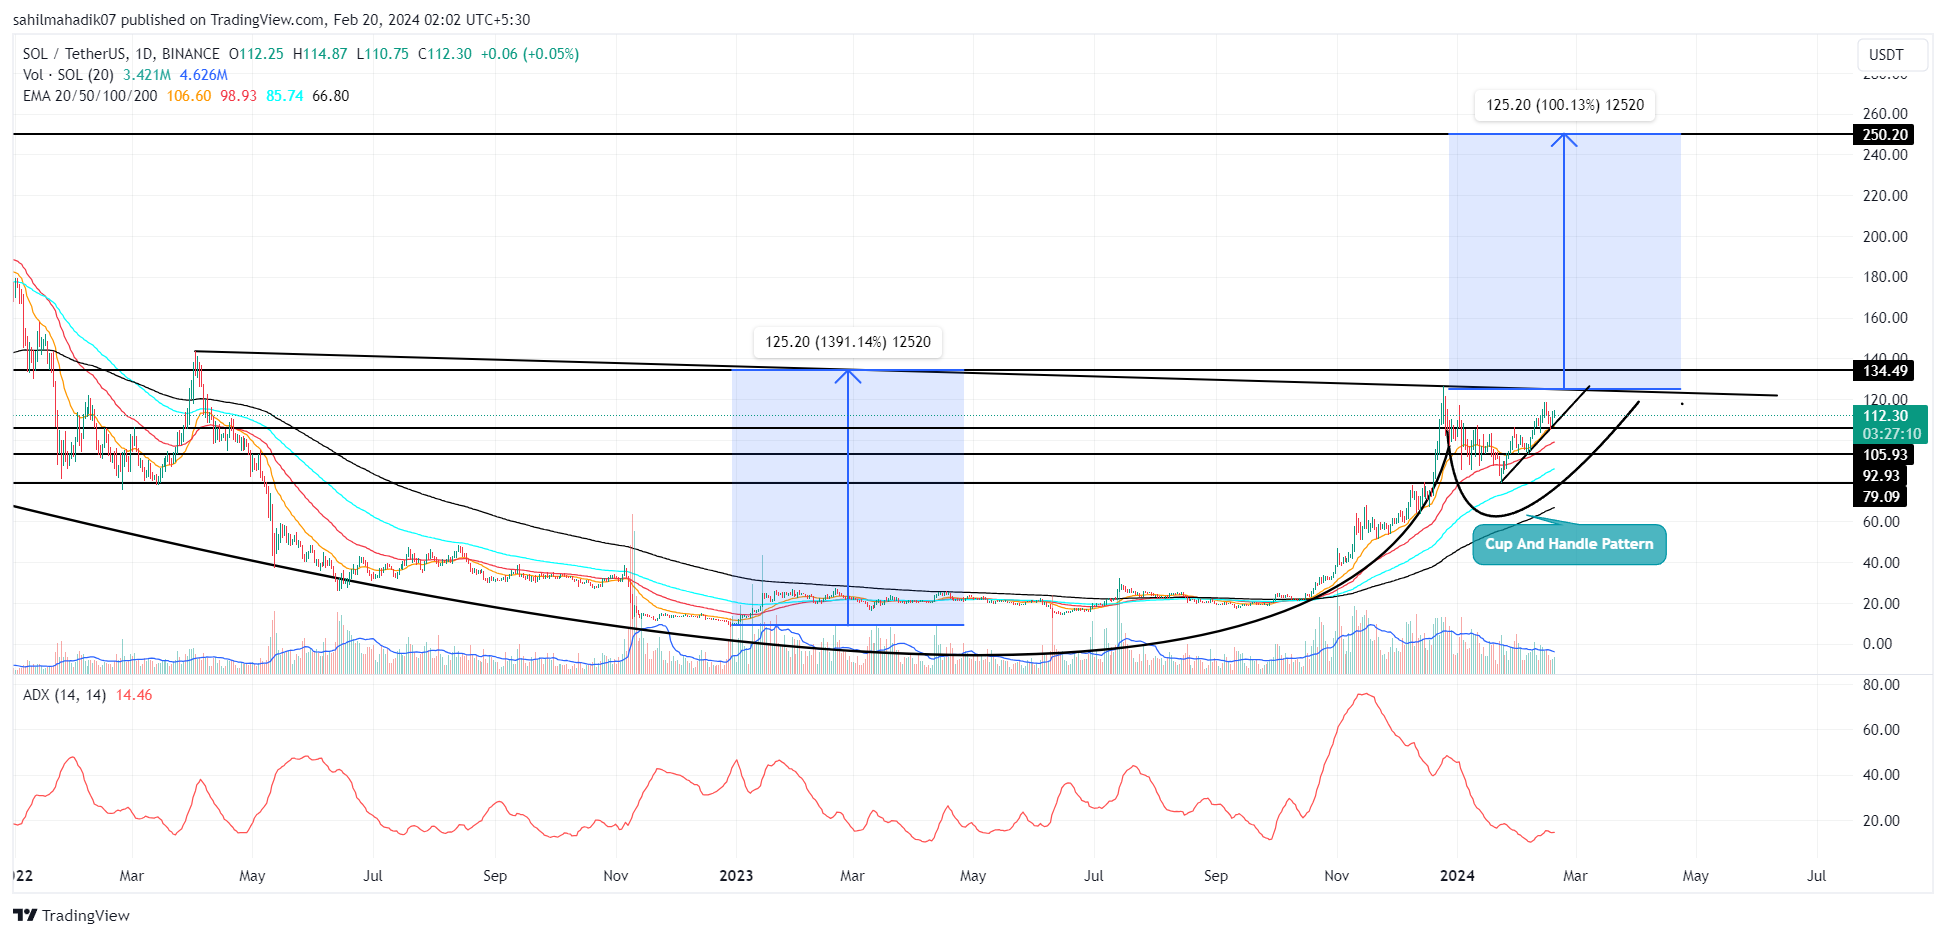
As Coingape earlier reported, the current upswing in SOL price is developing the handle portion of a cup and handle pattern. In theory, this pullback is the last correction the assets face before buyers give a massive breakout to trigger a directional trend. A bullish breakout from the resistance trendline at $125 will intensify the recovery momentum. With sustained buying, the buyers may chase the potential target of $250 if the pattern holds true.
If the lower support trendline is breached, the SOL price will be at risk of falling below $90.
Technical Indicator
- Exponential Moving Average: The fast-moving 20-and-50-day EMA may offer suitable pullback support to buyers.
- Average Directional Index: The ADX slope at 14% reflects the last correction assisted buyers in reviving strength for the higher rally.
Related Article: Crypto Prices Today: Bitcoin At 52K As ETH, XRP, PEPE Rebound


 Bitcoin
  Ethereum
  Tether
  Dogecoin
  USDC
USDC  Cardano
  TRON
TRON  Chainlink
  Stellar
  Hedera
  Bitcoin Cash
  LEO Token
  Litecoin
  Cronos
  Ethereum Classic
  Monero
  Dai
Dai  Algorand
  OKB
OKB  Cosmos Hub
  Stacks
  Theta Network
  Gate
Gate  Maker
Maker  KuCoin
  Tezos
Tezos  IOTA
IOTA  NEO
NEO  Polygon
  Zcash
Zcash  Synthetix Network
  Tether Gold
  TrueUSD
  Dash
Dash  Holo
Holo  Zilliqa
  Enjin Coin
  0x Protocol
  Siacoin
  Qtum
Qtum  Basic Attention
  Bitcoin Gold
  Ravencoin
  Decred
  NEM
NEM  DigiByte
  Ontology
  Nano
Nano  Status
  Waves
Waves  Huobi
Huobi  Lisk
Lisk  Hive
Hive  Numeraire
  Steem
Steem  Pax Dollar
  BUSD
BUSD  OMG Network
  Ren
Ren  Bitcoin Diamond
  Bytom
Bytom