XRP Nike Swoosh Pattern Signals Surge to $13, Says Leading Chartist

Market analyst EGRAG draws out a structure he calls the “Nike swoosh pattern” on the monthly XRP chart, expecting it to take XRP to $13.
EGRAG, known for his unconventional charting styles, disclosed this in his latest XRP price analysis. The report comes as XRP continues to battle the pivotal $0.60 psychological resistance level. Several market commentators have identified the importance of this level for XRP’s uptrend.
XRP Forms “Nike Swoosh” Pattern
However, a push beyond the $0.60 mark on Sept. 21 faced intense opposition from the bears. Subsequently, XRP dropped to $0.59 and now trades at the $0.58 region. Despite this, EGRAG’s chart confirms that XRP’s recent price action keeps it within the Nike swoosh pattern.
According to the market analyst, the formation of this pattern began in January 2018, amid XRP’s collapse from the all-time high. As XRP retraced the gains it picked up in 2017, it recorded a massive 96% crash from $3.31 in January 2018 to a bottom price of $0.1140 in March 2020. This drop marked the formation of the initial part of the swoosh.
XRP Nike Swoosh Pattern | EGRAG Crypto
Interestingly, with the $0.1140 floor price representing the lower end of the swoosh curve, XRP has only recovered from this level. Since March 2020, XRP has continued to witness higher lows, as buyers step into the scene. The higher lows have resulted in the formation of the upward sloping end of the Nike swoosh.
A Possible $13 Target
XRP has continued to leverage the upward sloping curve from the swoosh as support. EGRAG believes this pattern will persist over the next few months, as the altcoin retains its higher lows campaign. Should XRP sustain the structure, EGRAG expects an imminent price surge.
He derived his target for this surge by drawing a height from the downward sloping line formed as the cover to the initial part of the swoosh. From this height, he sees XRP reaching as high as $13, a 2,135% increase from the current level.
Interestingly, multiple analysts have predicted this $13 price target for XRP, but with varying rationales. For instance, in May, Matthew Dixon, CEO of Evai, asserted that XRP could target $13. Analyst Casi also projected a $13 price for XRP following a breakout from its six-year consolidation pattern.
XRP Short-Term Movements
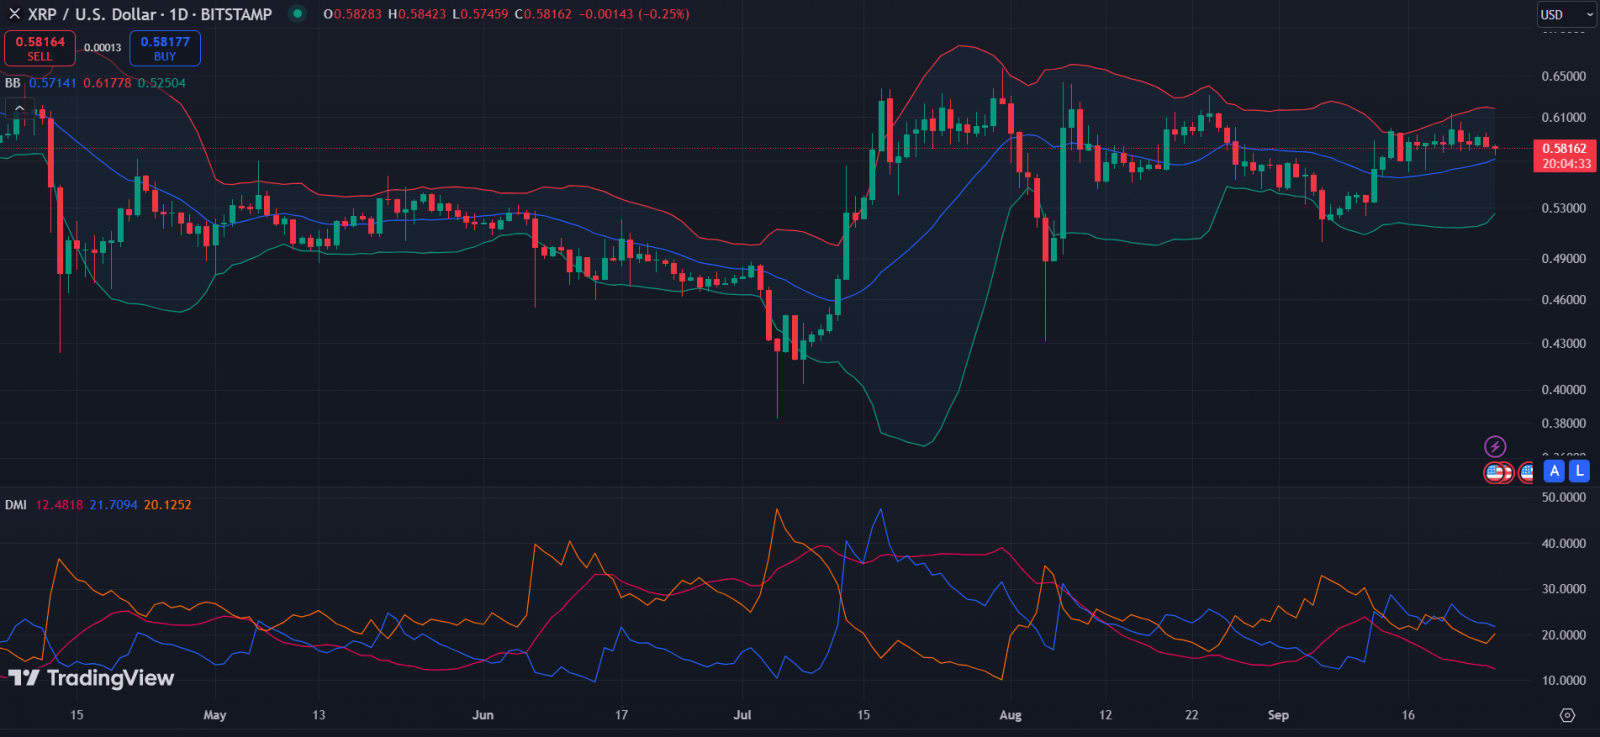
Meanwhile, in the short term, XRP has continued to respect the $0.6178 resistance at the upper Bollinger Band. XRP currently trades for $0.58162, down 1.87% over the past 24 hours. Despite the drop, it trades above the middle Bollinger Band ($0.5714), which it will leverage as support should a steeper crash occur.

XRP 1D Chart
Notably, XRP’s Directional Moving Index (DMI) shows the +DI at 21.7 and the -DI at 20.15, indicating that the bulls have a slight edge. However, with the ADX at 12.48, this bullish momentum is extremely weak, as the market remains indecisive. A push to either side could make or mar XRP in the short term.


 Bitcoin
  Ethereum
  Tether
  Dogecoin
  USDC
USDC  Cardano
  TRON
TRON  Chainlink
  Stellar
  Hedera
  Bitcoin Cash
  LEO Token
  Litecoin
  Cronos
  Ethereum Classic
  Monero
  Dai
Dai  Algorand
  OKB
OKB  Cosmos Hub
  Stacks
  Theta Network
  Gate
Gate  Maker
Maker  KuCoin
  Tezos
Tezos  IOTA
IOTA  NEO
NEO  Polygon
  Zcash
Zcash  Synthetix Network
  Tether Gold
  TrueUSD
  Dash
Dash  Holo
Holo  Zilliqa
  0x Protocol
  Enjin Coin
  Qtum
Qtum  Siacoin
  Basic Attention
  Ravencoin
  Bitcoin Gold
  Decred
  NEM
NEM  Ontology
  DigiByte
  Nano
Nano  Status
  Huobi
Huobi  Hive
Hive  Lisk
Lisk  Waves
Waves  Numeraire
  Steem
Steem  Pax Dollar
  BUSD
BUSD  OMG Network
  Ren
Ren  Bitcoin Diamond
  Bytom
Bytom