XRP Rival Stellar (XLM) May See Short-Term Pain, Bollinger Bands Signal

The price of the Stellar token XLM is looking at a bearish scenario, despite an impressive start to the year. Recently, XLM, which is considered by many as a beta play on XRP, saw its quotes skyrocket by over 35% to settle at $0.46.
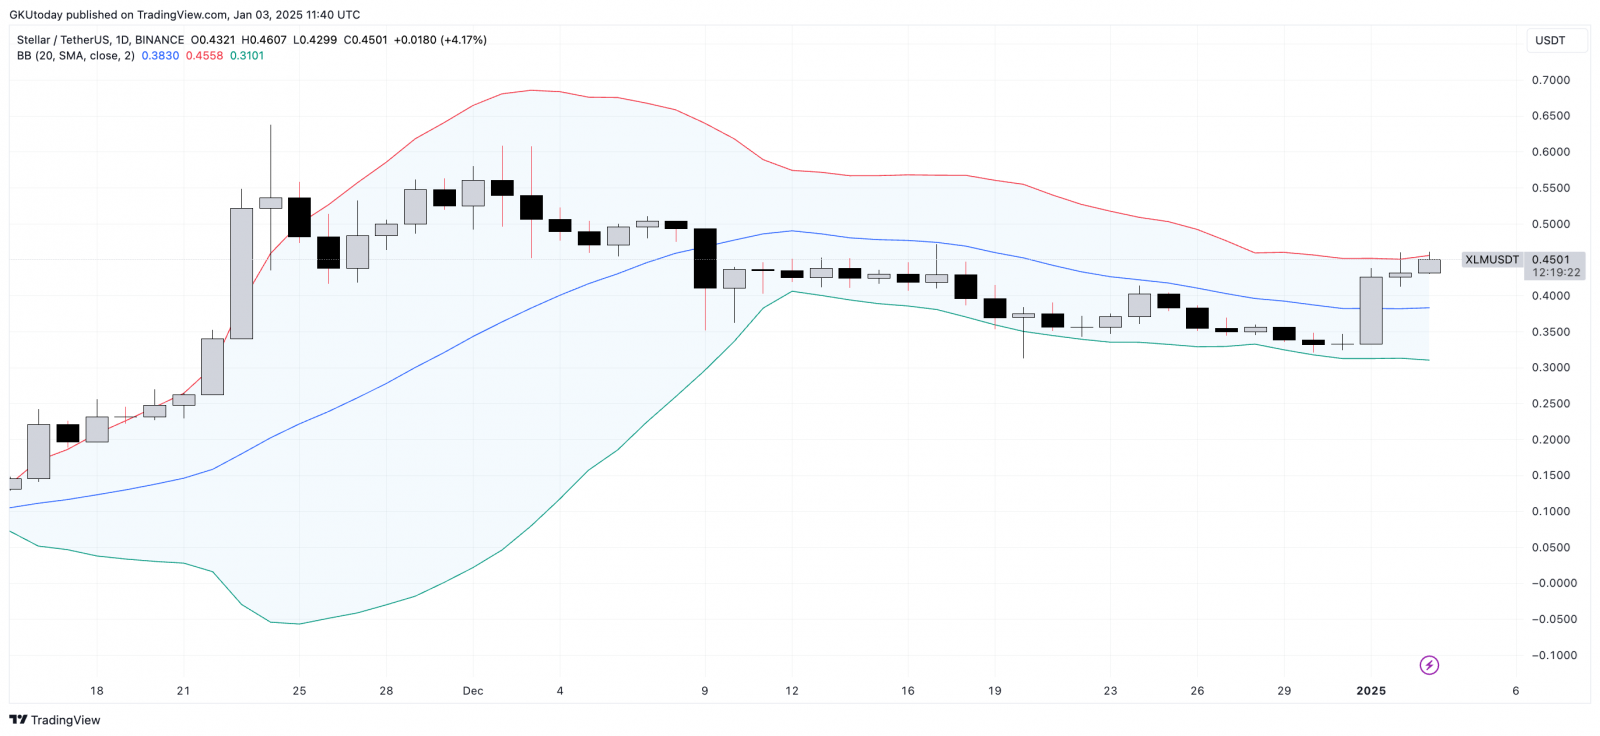
However, this local bull rally for the Stellar token may soon see a short-term downtrend. At least the Bollinger Bands indicator signals such a possibility. Developed by renowned trader John Bollinger, the indicator displays a 20-day moving average and two deviations from it — one to the upside and another to the downside. All three curves together form a price range.
For example, after the recent spike, the price of XLM reached the top of the range at $0.46, which is exactly where the upper band stretches. Typically, this serves as a range boundary and local stop after strong moves.
If that’s the case, then at least a drop to the median is in the cards for XLM, and right now it’s at the $0.382 level, which is 15.45% below the current price.

Alternatively, a drop to the lower band should also be considered, as the previous price action of the Stellar token shows.
In this case, XLM may see its quotes fall as low as $0.31, which is 31.3% down from today’s price. The second scenario may not be as short term, and does not quite fit the logic of XLM’s current price action, as such a drop would wipe out all of the gains of the past few days.
In fact, the upper band has been reached, and the possibility of further growth for the Stellar token is currently lower than the possibility of a correction.


 Bitcoin
  Ethereum
  Tether
  Dogecoin
  USDC
USDC  Cardano
  TRON
TRON  Chainlink
  Stellar
  Hedera
  Bitcoin Cash
  Litecoin
  LEO Token
  Cronos
  Ethereum Classic
  Monero
  Dai
Dai  Algorand
  OKB
OKB  Cosmos Hub
  Stacks
  Theta Network
  Gate
Gate  Tezos
Tezos  Maker
Maker  KuCoin
  IOTA
IOTA  NEO
NEO  Polygon
  Zcash
Zcash  Synthetix Network
  Tether Gold
  Dash
Dash  TrueUSD
  Holo
Holo  0x Protocol
  Zilliqa
  Enjin Coin
  Basic Attention
  Qtum
Qtum  Siacoin
  Ravencoin
  Bitcoin Gold
  Decred
  Hive
Hive  DigiByte
  NEM
NEM  Ontology
  Huobi
Huobi  Nano
Nano  Status
  Waves
Waves  Lisk
Lisk  Steem
Steem  Numeraire
  Pax Dollar
  BUSD
BUSD  OMG Network
  Ren
Ren  Bitcoin Diamond